






Nvidia Leadership Shock, Rising Treasury Yields and Small-Cap Weakness Weigh on Wall Street
The Canadian Vanguard Stock Market Report Thursday, November 12, 2026, Edition
.
The Toronto Market
Thursday’s Toronto Market Index
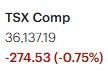
The S&P/TSX Composite Index declined 274.53 points, or 0.75%, to close at 36,137.19.
After closing higher on Wednesday, the TSX practically surrendered all of its previous day’s gains today. The question now is whether the current challenges facing Nvidia Corp. could disrupt the recovery attempt by AI-related stocks.
Regardless, one thing is clear: Artificial intelligence is here to stay.
Market breadth was negative today, underscoring the need for traders and investors to remain cautious. At this stage, the priority should be taking appropriate steps to protect capital while waiting for a more convincing and sustainable market recovery.
One prudent approach is to limit market exposure to approximately 25%–50% of portfolio value, depending on individual risk tolerance. This strategy can help reduce potential losses and preserve capital while waiting for a market turnaround to develop and establish a confirmed upward trend.
From a technical perspective, the TSX Composite Index closed slightly above both its 21-day and 50-day moving averages. Encouragingly, it also remains comfortably above its 200-day moving average, suggesting that the broader longer-term trend has not yet been compromised.
For now, caution, disciplined risk management, and capital preservation should remain the guiding principles.
Thursday’s TSX Market Statistics
At the Toronto Stock Exchange (TSX), declining issues (decliners) significantly outnumbered advancing issues (advancers). Specifically, there were 1,759 decliners and 532 advancers, resulting in a decliner-to-advancer ratio of approximately 3.30 to 1. In other words, there were roughly 3.3 declining stocks for every advancing stock. An additional 107 issues remained unchanged.
These figures indicate clearly negative market breadth, suggesting that the market’s internal indicators weakened considerably during today’s trading session.
The exchange recorded 15 new 52-week highs and 28 new 52-week lows, compared with 23 new 52-week highs and 14 new 52-week lows recorded yesterday.
The relationship between new highs and new lows deteriorated significantly today. The ratio of new 52-week highs to new 52-week lows was 15 to 28, or approximately 0.53 (53%). This compares unfavourably with yesterday’s ratio of 23 to 14, or approximately 1.64 (164%). In other words, yesterday saw considerably stronger participation among stocks reaching new highs, while today’s figures indicate a noticeable deterioration in market internals.
Trading volume also increased on the TSX today, reaching 451,126,000 shares, approximately 15.5% higher than yesterday’s volume of 390,443,000 shares.
The combination of increased trading volume, significantly more declining stocks than advancing stocks, and a greater number of new 52-week lows than new highs is a concerning development. It suggests that selling pressure intensified during today’s session.
Investors and traders should continue to monitor the market’s internal indicators closely. These statistics can provide valuable early clues about a potential change in market direction and help identify when a sustainable recovery may be developing.
For now, patience and discipline remain essential. It is generally prudent to wait for convincing confirmation of a market turnaround before committing substantial additional capital or undertaking major trading positions.
Thursday’s Toronto Stock Exchange (TSX) Market Wrap-Up Report
A Broadly Negative Trading Session as Market Internals Weaken
The Toronto Stock Exchange experienced a broadly negative and rather disappointing trading session on Thursday, with selling pressure dominating the overall market. The S&P/TSX Composite Index declined 274.53 points, or 0.75%, to close at 36,137.19, practically surrendering Wednesday’s gains.
Although a number of sectors managed to post gains, the overall market performance reflected considerable weakness. More importantly, the deterioration in market breadth and other internal indicators suggests that the market’s recovery attempt remains vulnerable.
Sector Performance
Among the sectors, Commercial Services, up 13.16%, and Communications, up 13.13%, were the two strongest performers. Technology Services advanced 10.53%, followed by Retail Trade, which gained 9.86%.
Transportation, Utilities, and Industrial Services also recorded gains of 8.27%, 8.22%, and 7.46%, respectively.
On the downside, Distribution Services declined 7.35%, while Non-Energy Minerals fell 10.73%. Electronic Technology was the weakest-performing sector, dropping 15.82%.
Despite the gains recorded in several sectors, the overall market’s negative performance suggests that strength was not sufficiently widespread to offset the prevailing selling pressure.
Notable Company and Stock Developments
Celestica Inc. (TSX: CLS): Celestica continued its positive momentum following Wednesday’s sharp advance. The stock gained another 4.77% to close at $361.92. Its continued strength makes it a stock worth monitoring, particularly for traders looking for opportunities in technology-related shares. However, given the current uncertainty surrounding the technology sector and AI-related stocks, appropriate risk management remains important.
Shopify Inc. (TSX: SHOP): Shopify declined 1.49% to close at $209.41, with approximately 1.3 million shares traded. The stock’s weakness reflected the generally cautious tone in the market.
Bombardier Inc. (TSX: BBD.B): Bombardier declined 3.59% to close at $333.53, with approximately 366,000 shares traded.
The company had previously announced stronger-than-expected orders on November 5, describing the results as evidence that demand for business jets remains strong. Management also indicated that services revenue continued to come in ahead of expectations.
Despite today’s share-price weakness, Bombardier remains a stock worth keeping on the watchlist. Investors should, however, distinguish between the company’s underlying business prospects and the stock’s short-term market performance.
Banking Sector: All Big Six Banks Close Lower
The Canadian banking sector experienced a broadly negative session, with all six of Canada’s major banks finishing in the red.
Toronto-Dominion Bank (TSX: TD) and Royal Bank of Canada (TSX: RY) were the relative outperformers, each declining just 0.21%.
Royal Bank closed at $289.39, with approximately 1.6 million shares traded, while TD finished at $176.69, with approximately 2 million shares changing hands.
The remaining major banks also recorded losses:
- National Bank of Canada (TSX: NA) declined 0.26% to close at $216.65, with approximately 794,600 shares traded.
- Canadian Imperial Bank of Commerce (TSX: CM) fell 0.30% to close at $165.53, with approximately 1.3 million shares traded.
- Bank of Montreal (TSX: BMO) declined 0.42% to close at $246.71, with approximately 1.3 million shares traded.
- Bank of Nova Scotia (TSX: BNS) slipped 0.47% to close at $132.22, with approximately 1.7 million shares traded.
The fact that all six major banks declined is another indication that today’s weakness was not confined to a single segment of the Canadian equity market.
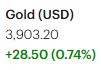
Gold and Mining Stocks: Gold prices moved lower today, putting additional pressure on some gold-related equities.
Agnico Eagle Mines Ltd. (TSX: AEM) declined 4.06% to close at $254.28, with approximately 627,400 shares traded.
Franco-Nevada Corporation (TSX: FNV) was comparatively more resilient, falling just 0.39% to close at $352.89, with approximately 321,600 shares traded.
The weakness in gold-related stocks is worth monitoring, particularly if gold prices continue to experience selling pressure. Traders interested in this sector should watch for signs of stabilization in the underlying commodity before making significant commitments.
Market Breadth and Internal Indicators: A Cause for Concern
Perhaps the most important development today was the deterioration in the TSX’s internal market indicators.
Declining issues significantly outnumbered advancing issues. Specifically, there were 1,759 decliners against 532 advancers, producing a decliner-to-advancer ratio of approximately 3.30 to 1. An additional 107 issues remained unchanged.
In practical terms, there were more than three declining stocks for every advancing stock. This represents decidedly negative market breadth.
The new 52-week highs and lows also painted a concerning picture. The exchange recorded only 15 new 52-week highs against 28 new 52-week lows.
This compares unfavourably with Wednesday’s figures of 23 new highs and 14 new lows.
Consequently, the ratio of new highs to new lows deteriorated from approximately 1.64 (164%) on Wednesday to just 0.54 (54%) today.
Trading volume also increased significantly. A total of approximately 451.1 million shares changed hands today, compared with 390.4 million shares on Wednesday, representing an increase of approximately 15.5%.
The combination of higher trading volume, substantially more declining stocks than advancing stocks, and more new 52-week lows than new highs suggests that selling pressure intensified during today’s session.
These developments deserve close attention because market internals can provide useful clues about the underlying health of the market, sometimes before those weaknesses become fully apparent in the major indexes.
TSX Technical Perspective
Despite today’s decline, the S&P/TSX Composite Index managed to close slightly above both its 21-day and 50-day moving averages. It also remains comfortably above its 200-day moving average.
This is an encouraging aspect of the market’s technical picture, as the longer-term trend has not yet been decisively compromised.
However, the weakening market internals raise questions about the sustainability of the current recovery attempt.
Traders should therefore avoid placing too much emphasis on the index’s position relative to its moving averages without considering the broader market’s participation and underlying strength.
Key Takeaways for Traders and Investors
Thursday’s trading session delivered several important messages that traders and investors should not ignore.
1. The market recovery remains vulnerable.
The TSX surrendered practically all of Wednesday’s gains. The negative market breadth and deterioration in new-high/new-low statistics suggest that the recovery attempt has not yet established a convincing foundation.
2. Pay close attention to market internals.
The 3.30-to-1 decliner-to-advancer ratio and the deterioration in the new-high/new-low ratio indicate that weakness is spreading beneath the surface. These indicators deserve continued monitoring for early evidence of improving market conditions.
3. Be selective with new positions.
This is not an ideal environment for aggressive buying or taking on excessive market exposure. Traders should focus on stocks demonstrating relative strength and avoid chasing sharp price advances without appropriate confirmation.
4. Protect portfolio capital.
As part of a prudent risk-management strategy, investors and traders may consider limiting their equity market exposure to approximately 25%–50% of total portfolio value, depending on individual risk tolerance, investment objectives, and time horizon.
The objective is to preserve capital and maintain sufficient flexibility to take advantage of better opportunities when market conditions improve.
5. Wait for confirmation before becoming more aggressive.
A meaningful market turnaround should ideally be accompanied by improving market breadth, a stronger new-high/new-low ratio, and sustained buying participation. A recovery in the TSX Composite Index alone may not be sufficient evidence of a genuine change in market direction.
Final Market Assessment
Thursday’s trading session was disappointing, and the deterioration in market internals should not be taken lightly.
Although the TSX remains above its important 21-day, 50-day, and 200-day moving averages, the underlying market statistics indicate that selling pressure has increased.
The current challenges facing Nvidia and other major AI-related stocks may also create additional uncertainty for the technology sector and the broader market. Nevertheless, artificial intelligence remains a significant long-term investment theme. The important consideration for investors is to distinguish between the long-term potential of the industry and the short-term risks associated with stock valuations and market volatility.
My recommendation at this stage is to remain cautious, exercise discipline, and make capital preservation a priority.
There will always be opportunities in the stock market. The objective is to ensure that sufficient capital remains available to take advantage of those opportunities when a sustainable market recovery is established and confirmed.
For now, patience is a strategy, and protecting capital is the priority.
The US Markets
Thursday’s US Market Indexes
All Four Major US Market Indexes Close Lower as Small-Caps Underperform
All four major US stock market indexes finished Thursday’s trading session in negative territory, although the losses among the three major large-cap indexes were relatively modest. The Russell 2000, which tracks small-cap stocks, experienced a considerably sharper decline and stood out as the weakest performer of the day.
Here is how the major indexes performed:
- Dow Jones Industrial Average: Declined 189.40 points, or 0.36%, to close at 52,297.09.
- S&P 500: Fell 26.98 points, or 0.35%, finishing at 7,592.40.
- Nasdaq Composite: Lost 100.10 points, or 0.39%, to close at 25,366.09.
- Russell 2000: Dropped 47.20 points, or 1.66%, ending the session at 2,799.06.

Market Performance and Trading Activity
The four indexes initially moved higher following Thursday’s opening bell, but the early optimism gradually faded. By midday, selling pressure had taken hold, and the indexes surrendered their earlier gains, eventually closing in negative territory.
The S&P 500 was marginally the best-performing index, declining just 0.35%, closely followed by the Dow Jones and Nasdaq Composite, which lost 0.36% and 0.39%, respectively.
The relatively narrow range of losses among these three indexes suggests that weakness was fairly contained within the large-cap market.
However, the Russell 2000 told a different story. Its 1.66% decline was considerably larger than the losses recorded by the other indexes, indicating greater weakness among small-cap stocks.
This divergence deserves attention, as small-cap stocks can provide useful additional insight into overall market risk appetite and investor confidence.
Technical Analysis: Major Moving Averages
The technical picture across the four major indexes remains mixed and calls for caution.
Dow Jones Industrial Average: The Dow Jones closed at 52,297.09 and moved below its 21-day and 50-day moving averages. However, your technical assessment indicates that it remains above its 200-day moving average.
This suggests that the index’s shorter-term technical position has weakened, although its longer-term trend has not yet been decisively compromised.
Nasdaq Composite: The Nasdaq remains clearly below its 21-day and 50-day moving averages. More importantly, it closed today only slightly below its 200-day moving average.
This is a significant technical development that traders should monitor closely. The 200-day moving average is an important longer-term trend indicator, and a decisive breakdown below this level could signal further deterioration in the Nasdaq’s technical condition.
For now, caution remains warranted.
S&P 500: The S&P 500 also remains below its 25-day and 50-day moving averages, reflecting continued weakness in its shorter-term technical position.
Nevertheless, the index managed to close above its 200-day moving average. This provides some reassurance that the longer-term trend remains intact, although the index needs to regain its shorter-term moving averages to establish a more convincing recovery.
Russell 2000: The Russell 2000 continues to trade below its 25-day and 50-day moving averages. Following today’s relatively sharp decline, the index is now considerably closer to its 200-day moving average.
This is particularly important because a sustained move below the 200-day moving average would represent a further deterioration in the small-cap market’s technical outlook.
Small-cap stocks are therefore an area that traders should watch particularly closely in the coming sessions.
Key Takeaways for Traders and Investors
Thursday’s market action provides several important signals:
- The broader market remains under pressure. All four major indexes closed lower, and the inability to sustain their early-session gains suggests that selling pressure remains present.
- Small-cap weakness deserves attention. The Russell 2000’s 1.66% decline was substantially greater than the losses recorded by the other indexes. This divergence suggests that investors may be becoming more selective and cautious about market risk.
- The Nasdaq’s 200-day moving average is an important level to monitor. With the index closing only slightly above this longer-term technical indicator, traders should watch for signs of further weakness or a successful recovery.
- The S&P 500 and Dow Jones need to regain their shorter-term moving averages. Remaining above their respective 200-day moving averages is encouraging, but the weakness in their shorter-term technical positions should not be ignored.
- Maintain disciplined risk management. This is not an environment that calls for aggressive buying or excessive portfolio exposure. Traders and investors should remain selective, protect existing capital, and wait for stronger evidence that the market is establishing a sustainable recovery.
Thursday’s session was another disappointing day for US equities. Although the losses among the Dow Jones, S&P 500, and Nasdaq Composite were relatively modest, the substantially larger decline in the Russell 2000 is a development worth monitoring.
The technical picture also remains somewhat concerning. The major indexes are struggling below their shorter-term moving averages, while the Nasdaq is hovering just below its 200-day moving average. The Russell 2000 is also approaching this important longer-term technical indicator.
For traders and investors, the message remains one of caution and discipline. A meaningful market recovery should ideally be supported by improving price action across all four major indexes, stronger market participation, and a sustained return above important moving averages.
Until such evidence emerges, capital preservation should remain a priority. It is better to wait for confirmation of a market turnaround than to commit substantial capital prematurely and expose portfolios to unnecessary downside risk.