
Major Market Indexes Rebound After Fed Rate Hike as Treasury Yields Edge Lower
The Canadian Vanguard Stock Market Report Thursday, September 17, 2026, Edition
.
The Toronto Market
Thursday’s Toronto Market Index
The Toronto S&P/TSX Composite Index rose 382.99 points, or 1.08%, to close at 35,874.26. The TSX had a strong performance today, marking a very positive market session.
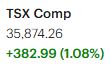

The index remains below the psychologically important 36,000 level, but today’s strong move suggests it could be setting up for another attempt to break above that level in the near term. We will have to wait and see.
The cost of borrowing money continued to trend lower today, as bond yields declined slightly.
The TSX was positive today, despite the market having to digest the U.S. Federal Reserve’s decision to raise interest rates by a quarter of a percentage point. Yesterday, the TSX initially declined sharply following the rate announcement but reversed course during the final half-hour of trading to close well above the session low.
From a technical perspective, the TSX remains below its 25-day moving average and is just below its 50-day moving average. However, the index remains comfortably above its 200-day moving average.
Thursday’s TSX Market Statistics
At the TSX, advancing issues (advancers) significantly outnumbered declining issues (decliners). Specifically, there were 1,774 advancers and 391 decliners, producing a real advancer-to-decliner ratio of 4.53 to 1 — roughly nine advancers for every two decliners. There were also 127 issues unchanged.
The exchange recorded 30 new 52-week highs and 37 new 52-week lows, compared with 22 new 52-week highs and 63 new 52-week lows yesterday. Market breadth was positive and strengthened today, while the ratio of new 52-week highs to new 52-week lows improved compared with the previous three sessions.
The number of new 52-week highs increased by 36%, while the number of new 52-week lows decreased by 42% from yesterday’s levels. The ratio of new 52-week highs to new 52-week lows was 4 to 5, or 4:5, which was the best reading in several sessions. Overall, the Toronto market’s internals improved today.
Total volume on the TSX reached 353,430,398 shares, 22% lower than the 449,642,752 shares traded yesterday. In other words, while the TSX index rose strongly, total trading volume declined.
This type of divergence occurs frequently on the TSX. Lower volume on an advancing market can indicate less conviction among investors, although volume can improve as a market advance develops. For now, however, the lower volume is a reason to remain cautious with trades. The market is certainly not yet showing the characteristics of a powerful uptrend.
Thursday’s Toronto TSX Market Wrap-Up Report
The Toronto S&P/TSX Composite Index posted a strong gain Thursday, rising 382.99 points, or 1.08%, to close at 35,874.26. The advance was broad-based, with market internals strengthening significantly and seven of the ten major sectors finishing higher.
The TSX continues to trade below the psychologically important 36,000 level, but Thursday’s strong advance brings the index close to that threshold. From a technical perspective, the TSX remains below its 25-day moving average and just below its 50-day moving average, while remaining comfortably above its 200-day moving average. A sustained move above 36,000, particularly if accompanied by stronger trading volume, would be something traders will likely be watching closely.
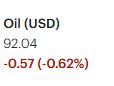
Bond yields edged lower Thursday, providing some relief for equity markets. The decline in yields was modest, however, and the broader North American markets remain sensitive to movements in interest rates and bond yields. Oil prices were also slightly lower.
Market Breadth Strengthens
Thursday’s market internals were notably positive. There were 1,774 advancing issues compared with only 391 declining issues, producing an advancer-to-decliner ratio of 4.53 to 1. In practical terms, there were roughly nine advancing stocks for every two declining stocks, with 127 issues unchanged.
The new-high/new-low statistics also improved. The TSX recorded 30 new 52-week highs and 37 new 52-week lows, compared with 22 new highs and 63 new lows Wednesday.
That represents a 36% increase in new 52-week highs and a 42% decrease in new 52-week lows compared with yesterday. The resulting 4:5 new-high-to-new-low ratio was the strongest reading seen in several sessions.
Overall, the improvement in breadth and the narrowing gap between new highs and new lows indicate that the underlying participation in Thursday’s advance was considerably healthier than in recent sessions.
There was, however, one important caveat: volume declined. Total TSX volume was approximately 353.4 million shares, down 22% from the 449.6 million shares traded Wednesday.
An advancing index accompanied by lower volume can indicate that investor conviction has not yet fully confirmed the move. It does not necessarily invalidate the advance, but it is a reason for traders to remain selective and watch whether volume expands if the index attempts to move through 36,000.
Sector Performance
The strength was broad-based across the TSX, although the magnitude of the gains varied considerably by sector.
Basic Materials was Thursday’s standout sector, rising 3.27%. Utilities gained 1.15%, Healthcare advanced 0.84%, Energy rose 0.63%, and Financials added 0.70%.
Technology, by contrast, declined 0.49%, while Telecommunications Services was the session’s weakest major sector, falling 1.59%.
The strong performance of Basic Materials was particularly notable given that many of the TSX’s biggest individual gainers came from the precious- and industrial-metals mining groups.
The Big Six Banks
Canada’s major banks also participated in the advance, with all six of the major bank stocks finishing higher. Bank of Nova Scotia (BNS) was the strongest performer among the Big Six, gaining 1.28%. Toronto-Dominion Bank (TD) followed with a 0.92% gain. Bank of Montreal (BMO) and Royal Bank of Canada (RY) each rose 0.66%, while Canadian Imperial Bank of Commerce (CIBC) gained 0.63%. National Bank of Canada (NA) advanced 0.56%.
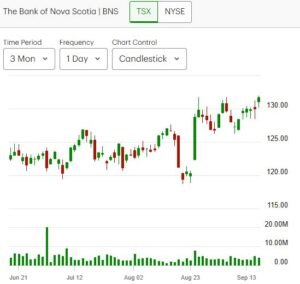
There has been an interesting pattern recently among the major bank stocks, with BNS, TD and BMO frequently rotating among the stronger performers. Of course, leadership within a group can change quickly, particularly in a market that remains sensitive to interest rates and bond yields.
For income-oriented investors, BNS remains a stock worth monitoring because of its dividend characteristics. Based on the figures in this report, its quarterly dividend yield is approximately 3.46%. The next ex-dividend date referenced in the draft is October 6. Investors should verify the current dividend and ex-dividend information before making any investment decision.
Individual Stocks to Watch
One of the more interesting statistics from Thursday’s session was the composition of the TSX’s top-performing stocks. Twenty-four of the top 25 performers were precious- or industrial-metal mining companies, with GFL Environmental Inc. (GFL) being the notable exception.
GFL stock gained 5.22%. The company provides environmental services including solid-waste and liquid-waste management, recycling, collection, transportation and disposal services.
The stock ranked 26th among Thursday’s strongest performers was (MDA), which gained 4.41%.
MDA Space recently unveiled its MDA CHORUS Earth-observation product portfolio, an end-to-end geointelligence offering designed to allow customers to customize, manage and control their geointelligence workflows.
From a technical perspective, MDA’s chart is interesting to watch. The stock appears to be in the early stages of developing the right side of a potential cup-shaped base. However, the stock remains below its 200-day moving average following the major market decline in July.
That makes MDA more of a watch-list candidate than a confirmed technical breakout at this stage. Traders may want to monitor whether the stock can continue building the right side of the base, regain important moving averages and eventually demonstrate stronger price and volume confirmation.
Key Takeaways for Traders and Investors
-
The TSX had a strong session: The 1.08% gain was accompanied by very strong market breadth, with advancers outnumbering decliners by 4.53 to 1.
-
Market internals improved: New 52-week highs increased while new lows declined substantially from Wednesday, producing the best high/low ratio seen in several sessions.
-
36,000 remains an important level: The TSX closed at 35,874.26, leaving it relatively close to the psychological 36,000 threshold.
-
Volume is the main cautionary signal: Trading volume fell 22% even as the index advanced. A stronger-volume advance would provide additional confirmation of improving market participation.
-
The technical picture is improving but not yet fully confirmed: The TSX remains below its 25-day and 50-day moving averages but is still well above its 200-day moving average.
-
Basic Materials led the market: The 3.27% sector gain was particularly strong and reflected the powerful performance of mining stocks.
-
Financials participated: All six major Canadian banks gained, although the magnitude of their advances varied.
-
Watch price and volume confirmation: For traders, the combination of a move through resistance, improving breadth and expanding volume would provide more information than any one indicator by itself.
-
MDA Space is worth monitoring: Its developing chart structure is interesting, but the stock remains below its 200-day moving average, so further technical improvement would be needed before the pattern becomes more meaningful.
Bottom Line
Thursday was an encouraging session for the Toronto market, particularly from a market-breadth and participation perspective. The sharp improvement in advancing issues and the better balance between new 52-week highs and lows suggest that the market’s internal condition strengthened.
At the same time, the 22% decline in trading volume prevents the advance from providing a complete technical confirmation. With the TSX approaching the 36,000 level, traders will be watching closely to see whether the index can push through that level and whether such a move is accompanied by stronger volume and continued breadth improvement.
For now, the market presents a combination of improving internals, improving breadth and a technically important resistance level, with volume remaining an important confirmation signal to monitor.
.
The US Markets
Thursday’s U.S. Market Indexes
All four major U.S. stock market indexes returned to positive territory Thursday after three consecutive sessions of declines. The rebound was broad-based, but the performance varied significantly among the major indexes, with the technology-heavy Nasdaq Composite clearly leading the market.
The Dow Jones Industrial Average rose 316.14 points, or 0.61%, to close at 51,778.04. The S&P 500 advanced 85.95 points, or 1.14%, to finish at 7,637.76. The Nasdaq Composite rallied 439.87 points, or 1.69%, to close at 26,418.30. The Russell 2000 gained 15.82 points, or 0.55%, to finish at 2,874.63.

The Nasdaq’s 1.69% advance was a high-octane performance, particularly considering that it came just one day after the U.S. Federal Reserve raised interest rates by a quarter of a percentage point. Technology stocks led the rebound, helping the Nasdaq significantly outperform the other major indexes.
The Dow Jones was positive but remained the weakest of the four major indexes. The Russell 2000, which represents smaller-cap stocks, also gained but lagged considerably behind the Nasdaq. Small-cap companies can be particularly sensitive to higher interest rates because of their financing needs and greater exposure to borrowing costs. Thursday’s positive performance across all four indexes nevertheless demonstrated that investors were willing to move back into equities despite the recent rate increase.
Technical Picture
The Nasdaq produced the most significant technical improvement Thursday. Following its 1.69% gain, the index moved back above both its 25-day and 50-day moving averages. This represents an important improvement in its short-term technical position.
The S&P 500 also strengthened, remaining below its 25-day moving average but moving clearly above its 50-day moving average.
The Dow Jones and Russell 2000 remain below both their 25-day and 50-day moving averages. Both indexes, however, continue to trade clearly above their respective 200-day moving averages.
This leaves an interesting divergence among the major U.S. indexes. The Nasdaq is showing the strongest short- and intermediate-term momentum, while the S&P 500 has regained ground relative to its 50-day moving average. The Dow and Russell 2000 still have more technical ground to recover.
Key Takeaways for Traders and Investors
-
The U.S. market bounced back strongly: All four major indexes finished higher after three consecutive down sessions.
-
Nasdaq was the clear leader: Its 1.69% gain substantially outpaced the Dow, S&P 500 and Russell 2000.
-
Technology led the rebound: The Nasdaq’s move back above both its 25-day and 50-day moving averages is an important technical development.
-
The S&P 500 improved: It remains below its 25-day moving average but is now clearly above its 50-day moving average.
-
Small caps remain technically weaker: The Russell 2000 is still below both its 25-day and 50-day moving averages, although it remains well above its 200-day moving average.
-
The Dow remains the weakest major index: It gained 0.61% but remains below its 25-day and 50-day moving averages.
-
Interest rates remain important: Thursday’s rebound came immediately after the Federal Reserve raised rates by 0.25 percentage point, demonstrating that equity markets can respond positively even when monetary policy remains restrictive.
-
The next few sessions will be important: Traders will want to see whether Thursday’s rebound develops into sustained buying or proves to be a short-term recovery following three consecutive declining sessions.
Bottom Line
Thursday produced a powerful rebound in U.S. equities, with the Nasdaq leading the recovery by a wide margin. The most notable technical development was the Nasdaq’s return above both its 25-day and 50-day moving averages.
However, the major indexes are not yet uniformly strong from a technical perspective. The Dow and Russell 2000 remain below their shorter-term moving averages, while the S&P 500 has more work to do to reclaim its 25-day average.
For traders, the key question now is whether Thursday’s high-energy rebound can attract follow-through buying and stronger market participation in the coming sessions. A continuation of the advance would provide more information about whether this was simply a rebound after three declining sessions or the beginning of a more sustained improvement in the U.S. equity market.
Thursday’s U.S. Market Statistics
New York Stock Exchange (NYSE): Market breadth on the New York Stock Exchange was positive Thursday, with advancing issues significantly outnumbering declining issues. There were 3,150 advancers, 1,320 decliners and 637 unchanged issues, producing an advancer-to-decliner ratio of 2.38 to 1 — approximately five advancers for every two decliners.
The NYSE recorded 112 new 52-week highs and 164 new 52-week lows, compared with 76 new highs and 430 new lows Wednesday.
This represents a significant improvement in the market’s internal condition. The number of new 52-week highs increased by approximately 47%, while new 52-week lows declined by approximately 62% from the previous session.
The new-high-to-new-low ratio improved to approximately 68%, or roughly 2 new highs for every 3 new lows, compared with only about 18% yesterday. While new 52-week lows still outnumbered new highs, the substantial improvement is noteworthy.
Total NYSE trading volume reached approximately 5.21 billion shares, about 2% below the 5.32 billion shares traded Wednesday.
Overall, the NYSE’s internals remain somewhat weak from a longer-term perspective, but the direction of change was clearly positive Thursday. The sharp reduction in new lows is particularly encouraging. Ideally, traders would eventually want to see new 52-week highs equal or exceed new 52-week lows, which would provide stronger confirmation of a broad-based market improvement.
Nasdaq: Market breadth was also positive on the Nasdaq. There were 3,388 advancing issues compared with 1,493 declining issues, producing an advancer-to-decliner ratio of 2.27 to 1 — more than two advancers for every decliner. Another 429 issues finished unchanged.
The Nasdaq recorded 95 new 52-week highs and 158 new 52-week lows, compared with 74 new highs and 398 new lows Wednesday.
The improvement in the Nasdaq’s internal statistics was significant. New 52-week highs increased by approximately 28%, while new 52-week lows declined by approximately 60% from Wednesday.
The new-high-to-new-low ratio improved to approximately 60%, meaning that there were about three new 52-week highs for every five new 52-week lows. That remains a negative balance because new lows still exceeded new highs, but it represents a substantial improvement from yesterday, when new highs were only about 19% of new lows.
The Nasdaq therefore showed positive daily breadth combined with a significant improvement in its 52-week high/low statistics.
Key Takeaways for Traders and Investors
-
Daily market breadth was positive on both exchanges. Advancers substantially outnumbered decliners on both the NYSE and Nasdaq.
-
The internal picture improved significantly from Wednesday. The most important development was the sharp decline in the number of new 52-week lows.
-
NYSE new lows fell 62%, while Nasdaq new lows declined approximately 60%.
-
New 52-week highs also increased: NYSE highs rose about 47%, while Nasdaq highs increased approximately 28%.
-
The 52-week high/low balance remains below ideal levels. New lows still exceeded new highs on both exchanges, so the improvement has not yet developed into a fully bullish internal structure.
-
The Nasdaq’s internal improvement is particularly worth watching because the Nasdaq Composite also posted the strongest gain among the major U.S. indexes Thursday and moved back above its 25-day and 50-day moving averages.
-
Volume did not provide a strong confirmation signal on the NYSE. Trading volume declined slightly despite the broad market advance.
-
The direction of the internals is improving. Traders should watch whether the reduction in new lows continues and whether new highs eventually begin to exceed new lows.
Bottom Line
Thursday’s market statistics provided meaningful evidence of improving U.S. market internals. The combination of positive daily breadth, a substantial decline in new 52-week lows and an increase in new highs represents a significant improvement from Wednesday’s much weaker readings.
However, the market has not yet reached the point where the 52-week high/low statistics provide full confirmation of a broad-based bullish environment. New lows still outnumber new highs on both the NYSE and Nasdaq.
The next few sessions should therefore be important. Continued improvement in the high/low balance — particularly a sustained decline in new lows accompanied by an increase in new highs — would provide stronger evidence that the market is transitioning toward a healthier and more broadly supported advance.
Thursday’s U.S. Market Wrap-Up Report
All four major U.S. stock market indexes rose firmly Thursday, producing a broad-based rebound after three consecutive sessions of declines. The market finished with a distinctly positive tone, led by a powerful recovery in technology stocks.
The Nasdaq Composite surged 1.69%, clearly outperforming the other major indexes. The S&P 500 gained 1.14%, the Dow Jones Industrial Average advanced 0.61%, and the Russell 2000 rose 0.55%.
Eight of the eleven major sectors finished higher. Technology, up 2.03%, was the clear sector leader. Basic Materials gained 1.60%, followed by Consumer Discretionary at 1.00%, Healthcare at 0.98%, and Utilities at 0.81%. Financials advanced 0.58%.
On the weaker side, Consumer Staples declined 0.35%, while Telecommunications Services was the session’s major laggard, falling 2.22%.
Technology Leads the Rebound
Technology stocks provided much of the market’s momentum Thursday. The Nasdaq’s 1.69% gain was a high-octane rebound, particularly because it came immediately after the Federal Reserve raised its policy rate by a quarter of a percentage point.
Several semiconductor and technology names posted particularly strong gains. Intel (INTC) jumped 7.67%, while Advanced Micro Devices (AMD) gained 6.36%. Semiconductor stocks were broadly stronger, with Arm Holdings rising 8.60%, Sandisk (SNDK) gaining 6.21%, and Micron Technology (MU) advancing 5.50%.
The strong performance in technology and semiconductor stocks was a major factor behind the Nasdaq’s outperformance.
Treasury Yields and Oil
Treasury yields and oil prices both pulled back Thursday. The decline in Treasury yields provided some relief to equity markets, particularly interest-rate-sensitive growth and technology stocks.
The relationship between bond yields and equities remains important for traders. Higher yields can increase the relative attractiveness of fixed-income investments and raise financing and valuation pressures for companies whose valuations depend heavily on future earnings. Thursday’s decline in yields therefore provided a more supportive backdrop for stocks.
However, traders should continue to monitor Treasury yields closely because the Federal Reserve remains focused on inflation and monetary policy remains an important driver of equity-market sentiment.
Market Internals Improve
The positive performance was supported by improving market breadth.
On the NYSE, 3,150 stocks advanced compared with 1,320 decliners, producing an advancer-to-decliner ratio of 2.38 to 1. On the Nasdaq, there were 3,388 advancers and 1,493 decliners, producing a ratio of 2.27 to 1.
The 52-week high/low statistics also improved substantially from Wednesday. On the NYSE, new 52-week highs increased approximately 47%, while new 52-week lows fell approximately 62%. On the Nasdaq, new highs increased about 28%, while new lows declined approximately 60%.
This is an important improvement in the market’s internal condition. However, new 52-week lows still outnumbered new highs on both exchanges. The improvement is therefore encouraging, but the high/low statistics have not yet reached a level that would provide complete confirmation of a broadly bullish market.
Trading volume on the NYSE was approximately 5.21 billion shares, about 2% below Wednesday’s 5.32 billion shares. The combination of strong price gains and slightly lower volume means traders may want to see additional volume expansion to confirm that Thursday’s rebound has strong underlying conviction.
Technical Picture
The Nasdaq produced the strongest technical improvement of the major indexes Thursday. Following its 1.69% advance, the index moved back above both its 25-day and 50-day moving averages.
The S&P 500 also improved, moving clearly above its 50-day moving average while remaining below its 25-day average.
The Dow Jones and Russell 2000 remain below both their 25-day and 50-day moving averages, although both remain comfortably above their respective 200-day moving averages.
This creates an important divergence among the major indexes. The Nasdaq has regained its shorter-term moving averages, while the Dow and Russell 2000 still have technical ground to recover.
Individual Stocks in Focus
Generac Holdings (GNRC) was the S&P 500’s strongest performer Thursday, surging approximately 18% after the backup-power company announced a $2.4 billion agreement to supply Amazon with generators for its data centers.
Amazon (AMZN) shares also benefited, gaining approximately 2.1%.
The Generac move highlights an increasingly important theme within the technology and artificial-intelligence investment cycle: the demand for infrastructure required to support data centers, including reliable backup power.
Key Takeaways for Traders and Investors
-
The U.S. market staged a strong rebound: All four major indexes finished higher after three consecutive declining sessions.
-
Nasdaq was the clear leader: Its 1.69% advance substantially exceeded the gains in the S&P 500, Dow and Russell 2000.
-
Technology led the market: The 2.03% sector gain and strong semiconductor performance drove much of the Nasdaq’s advance.
-
Nasdaq’s technical position improved: It moved back above both its 25-day and 50-day moving averages.
-
Market breadth strengthened: Advancers substantially outnumbered decliners on both the NYSE and Nasdaq.
-
The 52-week high/low picture improved: New lows declined sharply on both exchanges, although new lows still exceeded new highs.
-
Volume remains a consideration: NYSE volume was slightly lower despite the strong advance, so additional volume expansion would provide useful confirmation of continued buying interest.
-
Interest rates remain a key market variable: Thursday’s decline in Treasury yields provided a more supportive environment for growth and technology stocks following the Federal Reserve’s rate increase.
-
Small caps still lag: The Russell 2000 gained only 0.55% and remains below both its 25-day and 50-day moving averages.
-
Follow-through will matter: Traders will be watching whether Thursday’s rebound develops into sustained buying rather than simply representing a recovery following three weak sessions.
Bottom Line
Thursday was a strong recovery session for U.S. equities, with technology stocks and the Nasdaq leading the advance. The combination of positive daily breadth, a sharp reduction in new 52-week lows and the Nasdaq’s move back above its 25-day and 50-day moving averages represents a meaningful improvement from the previous session.
At the same time, the market’s internal structure is improving rather than fully confirmed. New 52-week lows still exceed new highs, trading volume did not expand materially, and the Dow and Russell 2000 remain below their shorter-term moving averages.
For traders and investors, the next step is to watch for follow-through, improving high/low statistics and stronger volume. Those factors should help determine whether Thursday’s powerful rebound develops into a more sustained market advance.
.
NOTICE TO READERS
The Canadian Vanguard Stock Market is about empowering you to build and manage your wealth by yourself. There is certainly no magic in managing finances or wealth but one needs to know what to do and commit to doing what is needed. When you are ready to start the journey to Take Charge and Put Your Destiny In Your Own Hands, start with reading The Canadian Vanguard every market day. If and when you need more related information or to advertise your business products or services in The Canadian Vanguard, Contact Us
Our readers are strongly advised to conduct their own research into individual stocks before making a purchase decision. In addition, investors are advised that past stock performance is no guarantee of future price appreciation. Any recommendation is not a guarantee of any particular stock’s future prices, and The Canadian Vanguard accepts no responsibility or liability for investors’ or readers’ purchases.
Stocks In The News/ Stocks To Watch and Market Strategy will soon be available only to Paying Subscribers. The dollar sign “$” in the Toronto Market section in the articles only stands for Canadian dollar and in the US market section “$” stands for US dollar.
(c) This article is published by The Canadian Vanguard on September 17, 2026