
Small Caps Lead as Tame Inflation Lifts Stocks Despite Big-Cap Weakness
The Canadian Vanguard Stock Market Report Wednesday August 12, 2026 Edition
.
The Toronto Market
.
Wednesday Toronto Market Index
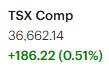
The Toronto S&P/TSX Composite Index advanced 186.22 points, or 0.51%, to close at 36,662.14.
Market breadth in Toronto remained positive and strengthened during today’s session. The TSX has now advanced for four consecutive trading sessions, with today’s gain notably stronger than yesterday’s increase. The index also reached a new record high during today’s session.
The TSX has recorded a higher session low in each of the last five sessions, indicating continued underlying strength. The index has also closed higher in five consecutive sessions, highlighting the positive momentum currently supporting the market.
The index continues to extend its distance above the 25-day, 50-day and 200-day moving averages, another indication of the market’s strengthening technical position.
The list of the top 25-performing stocks in today’s session was broad-based, with representation from virtually all major sectors of the Toronto market. This breadth provides further evidence that the current strength is not concentrated in only a handful of sectors or stocks.

.
Wednesday’s TSX Market Statistics
At the TSX, advancing issues significantly outnumbered declining issues. There were 1,487 advancers and 668 decliners, producing an advancer-to-decliner ratio of approximately 2.23 to 1, or roughly two advancers for every decliner. A total of 152 issues were unchanged.
The exchange recorded 160 new 52-week highs and 18 new 52-week lows, compared with 125 new 52-week highs and 31 new 52-week lows yesterday. This represents a substantial improvement in market breadth. Today’s ratio of new 52-week highs to new 52-week lows was approximately 9 to 1, meaning that new 52-week highs outnumbered new 52-week lows by roughly nine times. Yesterday, the corresponding ratio was approximately 4 to 1.
These market internals remain strongly bullish and indicate considerable underlying strength within the TSX. The broad participation among advancing issues, combined with the significant advantage of new 52-week highs over new 52-week lows, provides further confirmation of the current positive market trend.
Nothing in the stock market persists permanently. We therefore suggest that investors take advantage of the current bullish trend in the Toronto market while it lasts. At the same time, the stock market is highly dynamic and inherently unpredictable. The current trend could reverse as early as the next trading session, so caution and appropriate risk management remain essential.
Total trading volume on the TSX reached 417,007,874 shares, approximately 3% lower than the 428,829,841 shares traded yesterday. Despite the modest decline in volume, the underlying market breadth and internal strength remained firmly positive.
.
Wednesday’s Toronto TSX Market Wrap-Up Report
The Toronto S&P/TSX Composite Index advanced 186.22 points, or 0.51%, to close at 36,662.14, extending its winning streak to five consecutive sessions. The index also reached a new record high during Wednesday’s session.
The character of Wednesday’s market was notably stronger than earlier sessions this week. Market breadth was firmly positive, with 1,487 advancing issues compared with 668 declining issues, while 152 issues were unchanged. This produced an advancer-to-decliner ratio of approximately 2.23 to 1, meaning that more than two stocks advanced for every stock that declined.
The strength was also evident in the new-high/new-low statistics. The TSX recorded 160 new 52-week highs and only 18 new 52-week lows, producing a ratio of approximately 9 to 1. This compares with 125 new highs and 31 new lows on Tuesday, when the corresponding ratio was approximately 4 to 1. The improvement in both advancing issues and new-high leadership provides additional evidence that Wednesday’s market strength was broad-based rather than concentrated in a small number of stocks.
Market Trend and Internals
The TSX has now closed higher for five consecutive trading sessions and has advanced during the last four sessions. The index is also continuing to increase its distance above its 25-day, 50-day and 200-day moving averages. In addition, the TSX has recorded a higher session low in each of the last five sessions.
Taken together, these technical and breadth indicators point to considerable underlying strength. The market is displaying positive momentum not only at the index level but also internally, with a large number of stocks participating in the advance.
However, traders should remember that market trends do not persist indefinitely. The TSX can change direction quickly, particularly when geopolitical developments or other unexpected news affect investor sentiment. The current bullish trend therefore provides opportunities, but it does not eliminate risk.
Sector Performance
Wednesday’s sector performance was considerably more positive than earlier in the week. Six of the ten major TSX sectors gained, compared with only three sectors advancing on Tuesday.
Financials was the strongest major sector, advancing 0.98%, followed by Industrials, up 0.70%; Basic Materials, up 0.54%; and Utilities, up 0.27%.
The weaker areas of the market included Consumer Durables & Services, down 0.20%; Consumer Discretionary Goods & Services, down 0.22%; and Technology, down 1.71%. Technology was the clear laggard sector on Wednesday.
The sector performance was therefore somewhat uneven, but the overall market remained firmly positive because of the strength in Financials and several other economically important sectors.
Financials Lead the Market
Financial stocks were among the principal drivers of Wednesday’s TSX advance. The strength was particularly noticeable among Canada’s major banks.
Five of the six large Canadian banks gained more than 1.5%. Canadian Imperial Bank of Commerce (CM) advanced 1.81%, closing at $168.63 on approximately 2.5 million shares. Toronto-Dominion Bank (TD) gained 1.70%, closing at $171.98 on approximately 2.3 million shares.
Bank of Nova Scotia (BNS) advanced 1.73%, closing at $125.95 on approximately 2.2 million shares, while National Bank of Canada (NA) gained 1.67%, closing at $228.85 on approximately 1.3 million shares. Royal Bank of Canada (RY) rose 1.51%, closing at $297.56 on approximately 3.3 million shares.
Bank of Montreal (BMO) also gained, advancing 1.40%.
The broad strength among the major banks is particularly important for TSX traders because Financials represent a substantial component of the Canadian market. Strength across virtually all of the major banks provides a much stronger signal than a gain driven by only one or two financial stocks.
Technology Remains a Weak Spot
Technology was the weakest major sector on Wednesday, declining 1.71%.
The TSX technology sector is heavily influenced by Shopify, and weakness in Shopify can have a significant impact on the sector’s overall performance. This relationship is important for traders monitoring the TSX because a decline in the technology sector does not necessarily mean that weakness is developing across the entire Canadian market.
There was, however, significant strength in individual technology-related names. Celestica (CLS) advanced 9.20%, with approximately 780,000 shares traded. Despite the strong daily gain, traders should note the stock’s technical position: Celestica closed only slightly above its 200-day moving average and remained below its 50-day moving average.
This is an important distinction for traders. A large one-day percentage gain can represent improving momentum, but the longer-term technical picture still needs to be monitored before concluding that a sustained trend reversal has occurred.
Broad-Based Strength Among Leading Stocks
The top 25-performing TSX stocks on Wednesday provided further evidence of broad market participation. The list included mining companies, financial institutions, technology companies, retail companies and a satellite/space communications company.
The diversity of the leaders is encouraging from a market-breadth perspective. When leadership extends across multiple sectors, the advance generally has a broader foundation than when only one sector is responsible for most of the market’s gains.
Interestingly, Air Canada was the top-performing TSX stock on Wednesday. It is relatively unusual for an airline stock to lead the entire TSX during a trading session, making Air Canada’s performance particularly noteworthy.
Trading Volume
Total TSX trading volume reached 417,007,874 shares, approximately 3% below Tuesday’s volume of 428,829,841 shares.
The modest decline in volume is worth noting, but it did not prevent the market from producing a strong advance with excellent breadth and a substantial advantage in new 52-week highs. For traders, the combination of price strength and strong participation across individual issues remains more encouraging than the small decline in total volume alone would suggest.
Geopolitical Risk Remains Relevant
The TSX experienced considerable volatility in July, much of it associated with geopolitical tensions in the Middle East. While Wednesday’s market action was strongly bullish, traders should not ignore the potential for geopolitical developments to produce abrupt changes in market sentiment.
Technical analysis and chart preparation remain essential, but in the current environment, preparation for the next trading session should also include staying informed about significant geopolitical developments, particularly developments involving the Middle East and any changes that could affect energy prices, interest-rate expectations, currencies or overall risk appetite.
Key Takeaways for Traders and Investors
1. The bullish trend remains intact.
The TSX has closed higher for five consecutive sessions and reached a new record high on Wednesday. The index is also maintaining a significant position above its 25-day, 50-day and 200-day moving averages.
2. Market breadth is a major positive.
With 1,487 advancers versus 668 decliners, advancing issues outnumbered declining issues by more than two to one. This is a considerably stronger breadth reading than one would see in an advance driven by only a handful of large-cap stocks.
3. New highs substantially outnumber new lows.
The 160 new 52-week highs versus only 18 new lows produced an approximately 9-to-1 ratio. This is one of the strongest internal signals from Wednesday’s session.
4. Financials are providing important leadership.
The broad gains among Canada’s major banks helped support the TSX and indicate that one of the exchange’s most influential sectors is participating strongly in the advance.
5. Technology remains a potential weak point.
The Technology sector declined 1.71%, making it the weakest major sector on Wednesday. Traders should continue monitoring Shopify and other major technology components for signs that the sector is stabilizing or weakening further.
6. Watch individual stocks, not just the index.
The broad composition of the top 25 performers demonstrates that opportunities are emerging across multiple sectors. Celestica’s 9.20% gain, for example, illustrates the importance of examining individual charts even when a major sector is under pressure.
7. Strong breadth does not eliminate risk.
The current market internals are strongly bullish, but no trend lasts indefinitely. A reversal can occur quickly, particularly in response to unexpected geopolitical or economic developments. Traders should therefore participate in the current trend while maintaining disciplined risk management.
Bottom Line
Wednesday’s session was a strong and broadly based bullish session for the TSX. The combination of a new record high, a fifth consecutive positive close, strong sector participation, a 2.23-to-1 advancer-to-decliner ratio and a roughly 9-to-1 new-high-to-new-low ratio suggests that the current advance has considerable internal support.
For traders and investors, the message from Wednesday’s market is constructive: the trend remains bullish, and the breadth statistics are confirming the strength of the move. Nevertheless, the market is dynamic and unpredictable. The prudent approach is to respect the current trend, look for opportunities among leading stocks, and remain prepared for a reversal if the market’s technical and internal indicators begin to deteriorate.
.
The US Markets
Wednesday’s US Market Indexes
The major U.S. market indexes delivered a generally positive performance on Wednesday, with the Dow Jones Industrial Average being the only major index to finish lower. The S&P 500, Nasdaq Composite and Russell 2000 all advanced, with small-cap stocks again showing the strongest performance.
The Dow Jones slipped 21.58 points, or 0.04%, to close at 53,770.85. The S&P 500 gained 20.30 points, or 0.26%, finishing at 7,748.50. The Nasdaq Composite advanced 143.04 points, or 0.54%, to close at 26,588.49. The Russell 2000 increased 18.37 points, or 0.61%, finishing at 3,045.48.
The relative performance of the indexes continues to be noteworthy. Large-cap stocks are lagging while small-cap stocks continue to outperform. The Russell 2000 was once again the strongest-performing major index on Wednesday, reinforcing its position as the current leader among the major U.S. market indexes.

Nasdaq Approaches Resistance
The Nasdaq Composite gained 0.54% on Wednesday but appears to be encountering resistance around the 26,650 level. This area is becoming an increasingly important technical level for traders to monitor.
With the index closing at 26,588.49, the Nasdaq is approaching this potential resistance zone. A sustained move above 26,650 would be technically encouraging and could indicate that the index is ready to establish another leg higher. Conversely, repeated failures near this level could signal that short-term consolidation or a pullback is developing.
The positive technical feature is that the Nasdaq remains well above its 25-day, 50-day and 200-day moving averages. Therefore, even with resistance near 26,650, the broader technical trend remains favorable.
Small-Caps Continue to Lead
The Russell 2000 was the star performer on Wednesday, gaining 0.61% and extending its lead over the 25-day moving average.
The continued outperformance of the Russell 2000 is important because small-cap stocks often provide useful information about market risk appetite. When small-caps participate strongly while the major large-cap indexes lag, it can indicate that investors are willing to move further out along the risk spectrum rather than concentrating exclusively on the largest companies.
Both the Russell 2000 and S&P 500 remain well above their 25-day, 50-day and 200-day moving averages, supporting the view that the broader U.S. equity trend remains bullish.
.
What Wednesday’s Index Action Means for Traders and Investors
The current market setup remains constructive, but there are several technical developments worth watching.
First, small-cap leadership is a positive signal. The Russell 2000 continues to outperform the larger-cap indexes, and its position above the major moving averages suggests that the small-cap rally remains technically healthy.
Second, the Nasdaq’s 26,650 area is now an important resistance level. Traders should watch closely to see whether the index can decisively break above this level or whether sellers continue to appear near resistance.
Third, the Dow’s relative weakness should not be ignored. The Dow declined slightly on Wednesday while the other major indexes advanced. This reinforces the current pattern of large-cap leadership being less dominant than small-cap leadership.
Finally, the overall technical structure remains positive. The major indexes discussed here remain above their 25-day, 50-day and 200-day moving averages, which continues to favor the bulls from a trend-following perspective.
Key Takeaway for Traders and Investors
Small-cap leadership remains the most notable feature of the current U.S. market. The Russell 2000 is currently outperforming the major indexes, while the Nasdaq is approaching an important resistance area near 26,650.
For traders, a sustained Nasdaq breakout above 26,650 would be an important development to monitor. At the same time, continued Russell 2000 strength would provide additional confirmation that market participation is broadening beyond the largest technology and mega-cap companies.
The overall message remains bullish, but traders should watch resistance and relative strength carefully. A market can remain above its major moving averages while still undergoing short-term consolidation or a correction, so technical levels and changes in leadership remain important going into the next sessions.
Wednesday’s US Market Statistics
New York Stock Exchange (NYSE): Market breadth at the New York Stock Exchange remained positive on Wednesday, with advancing issues outnumbering declining issues. There were 1,493 advancers, 1,234 decliners and 94 unchanged issues, producing an advancer-to-decliner ratio of approximately 1.21 to 1. In practical terms, there were roughly six advancers for every five decliners.
The NYSE recorded 99 new 52-week highs and 62 new 52-week lows, compared with 322 new highs and 143 new lows on Tuesday. Both new highs and new lows declined substantially from the previous session.
The ratio of new 52-week highs to new 52-week lows was approximately 3 to 2 on Wednesday, compared with roughly 2 to 1 on Tuesday. While Tuesday’s breadth was somewhat stronger by this measure, the difference is not significant enough to alter the overall interpretation of the market. The more important observation is that new highs continued to substantially outnumber new lows.
Total NYSE trading volume reached 4,753,153,984 shares, approximately 2% lower than Tuesday’s 4,856,096,707 shares. This modest decline in volume is not particularly concerning. NYSE trading volume routinely fluctuates between sessions, often moving several percentage points in either direction.
Overall, NYSE market internals remained positive and supportive of the broader bullish trend. Advancers maintained the advantage over decliners, while new 52-week highs continued to outnumber new lows.
NASDAQ: The NASDAQ also produced positive market breadth on Wednesday. There were 2,862 advancing issues compared with 2,022 declining issues, resulting in an advancer-to-decliner ratio of approximately 1.41 to 1, or roughly seven advancers for every five decliners. Another 185 issues finished unchanged.
The positive breadth is consistent with the Nasdaq Composite’s 0.54% advance during Wednesday’s session. The number of unchanged issues increased slightly from Tuesday but remained close to its 50-day average, suggesting no unusual level of market indecision from this measure.
The NASDAQ recorded 238 new 52-week highs and 120 new 52-week lows, compared with 214 new highs and 105 new lows on Tuesday. Both new highs and new lows increased modestly, with new highs maintaining a substantial advantage.
The ratio of new 52-week highs to new 52-week lows was approximately 2 to 1, similar to Tuesday’s ratio. The relatively small change in this relationship suggests that the underlying market structure remains stable rather than showing a significant deterioration or improvement from the previous session.
Market Internals Remain Bullish
The most important message from Wednesday’s statistics is the continued stability of the market internals.
Both the NYSE and NASDAQ recorded more advancing stocks than declining stocks. New 52-week highs also continued to outnumber new 52-week lows on both exchanges. Although some individual breadth measurements were slightly weaker than Tuesday’s readings, the overall picture remains constructive.
This combination of positive breadth, continued new-high leadership and stable internals is favorable for traders and investors. The data do not suggest a broad-based deterioration in participation at this time.
The NASDAQ’s breadth was particularly encouraging, with approximately seven advancers for every five decliners. This supports the view that the strength in the Nasdaq Composite is being accompanied by reasonably broad participation rather than being driven exclusively by a small group of large technology stocks.
Key Takeaway for Traders and Investors
The U.S. market continues to show strong and stable internal conditions. Wednesday’s breadth was positive on both the NYSE and NASDAQ, and new 52-week highs remained ahead of new lows.
For traders, this is an encouraging backdrop for maintaining a bullish bias while the major indexes remain above their key moving averages. The fact that small-cap stocks, represented by the Russell 2000, continue to outperform adds another constructive element to the current market picture.
At the same time, investors should recognize that strong market internals are a confirmation of the current trend—not a guarantee that the trend will continue indefinitely. The most important signals to monitor in coming sessions will be a deterioration in the advancer-to-decliner ratios, a sustained increase in new 52-week lows, and any significant weakening in the major indexes relative to their key moving averages.
.
Wednesday’s US Market Wrap-Up Report
U.S. equity markets were more positive on Wednesday than during the previous two trading sessions, with the S&P 500, Nasdaq Composite and Russell 2000 all advancing, while the Dow Jones Industrial Average slipped marginally. The most notable feature of the session was continued small-cap leadership, with the Russell 2000 outperforming the major large-cap indexes.
The Dow Jones declined 21.58 points, or 0.04%, to close at 53,770.85. The S&P 500 gained 20.30 points, or 0.26%, to 7,748.50, while the Nasdaq Composite advanced 143.04 points, or 0.54%, to 26,588.49. The Russell 2000 was the strongest major index, rising 18.37 points, or 0.61%, to 3,045.48.
The relative performance of the indexes remains important for traders. Large-cap stocks continue to lag, while small-cap stocks continue to outperform. The Russell 2000 is currently the star performer among the major U.S. indexes, and its continued strength suggests that market participation is extending beyond the largest companies.
Market Internals Remain Positive
The underlying market statistics provided further confirmation that Wednesday’s advance was reasonably broad-based.
At the NYSE, there were 1,493 advancing issues versus 1,234 declining issues, producing an advancer-to-decliner ratio of approximately 1.21 to 1. At the NASDAQ, 2,862 stocks advanced compared with 2,022 decliners, producing a stronger ratio of approximately 1.41 to 1.
New 52-week highs also continued to outnumber new lows on both exchanges. The NYSE recorded 99 new highs and 62 new lows, while the NASDAQ recorded 238 new highs and 120 new lows.
Although the number of new highs on the NYSE was considerably lower than Tuesday’s exceptionally strong reading, the overall internal picture remains constructive. On the NASDAQ, the relationship between new highs and new lows remained broadly stable.
The combination of positive advancing/declining ratios and more new highs than new lows suggests that the market’s internal structure remains bullish rather than showing widespread deterioration.
Sector Performance
The U.S. market was considerably stronger on Wednesday, with the majority of the major sectors finishing higher. Industrials was the leading sector, gaining 1.57%, followed by Technology, up 0.81%; Utilities, up 0.78%; and Financials, up 0.69%. Energy also advanced, gaining 0.15%.
The weaker sectors included Basic Materials, down 0.38%; Telecommunications Services, down 0.57%; and Consumer Discretionary Goods & Services, down 0.93%. Retail-related stocks generally remained under pressure.
The strength in Industrials, Technology, Utilities and Financials provided a constructive foundation for the broader market advance. At the same time, the continued weakness among some consumer and retail stocks suggests that the rally is not occurring uniformly across all areas of the market.
AI, Cloud and Optical Networking Stocks Rebound
AI and cloud-computing stocks staged a notable rebound on Wednesday, supported by strong earnings reports and a relatively tame inflation report.
One of the strongest individual performers was Nebius Group, which surged 34.14% on approximately 63.5 million shares. The move demonstrates the appetite for high-growth AI-related names when market conditions become more favorable.
Optical networking companies also staged a strong rebound. However, traders should remain selective in this group. Many of these stocks suffered significant technical damage during the major selling period in July, and several still have weak or incomplete charts despite Wednesday’s sharp gains.
Coherent gained approximately 8% during regular trading hours before declining modestly following the release of its earnings report after the regular market session.
For traders, the important question is not simply whether these stocks can produce a one-day rebound. The more important question is whether the rebound can develop into a sustained technical recovery, including higher lows, improving moving-average structures and the eventual recovery of important resistance levels.
Memory and Data-Storage Stocks Show Strong Rebound
Memory and data-storage manufacturers were another area of strength on Wednesday.
Micron gained approximately 4.9%, with about 36.8 million shares traded. SanDisk advanced 5.76% on approximately 12.1 million shares, marking its second consecutive positive trading session. Seagate Technology (STX) rose 7.03%, with approximately 4.7 million shares traded.
These stocks are particularly interesting for traders because many suffered substantial declines during the previous six weeks. Wednesday’s gains therefore represent more than ordinary daily fluctuations; they could be the early stages of a potential technical recovery if the strength persists.
However, traders should avoid assuming that a sharp rebound automatically represents the beginning of a new long-term uptrend. After a substantial decline, stocks can experience powerful oversold rallies before resuming their previous trend. The next several sessions will be important in determining whether these moves develop into sustainable recoveries.
Nasdaq Approaches Important Resistance
The Nasdaq Composite closed at 26,588.49, bringing the index close to the 26,650 area, which is emerging as an important short-term resistance level.
A decisive move above 26,650 would be technically encouraging and could signal that the Nasdaq is ready to resume its advance. Conversely, repeated failures around this level could result in short-term consolidation or a pullback.
The broader technical picture remains favorable. The Nasdaq is still well above its 25-day, 50-day and 200-day moving averages, so resistance near 26,650 should currently be viewed within the context of an otherwise bullish trend.
Small-Cap Leadership Remains Important
The Russell 2000 gained 0.61%, making it the best-performing major U.S. index Wednesday. More importantly, the index increased its distance above its 25-day moving average.
Both the Russell 2000 and S&P 500 remain well above their 25-day, 50-day and 200-day moving averages.
The continued outperformance of the Russell 2000 is an encouraging development for market breadth. When small-cap stocks participate strongly, it suggests that investors are willing to assume more risk rather than concentrating their buying exclusively in mega-cap companies.
For traders, continued Russell 2000 leadership could therefore become an important confirmation signal for the broader market.
Oil and Middle East Geopolitical Risk
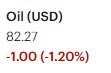
Oil prices edged lower during Wednesday’s regular session, but crude remains highly sensitive to developments in the Middle East. Geopolitical uncertainty continues to be a significant market-moving factor and should not be ignored by traders and investors.
Oil prices were moving higher later in the evening amid reports that the Strait of Hormuz remained blocked, while investors continued to weigh potentially weaker demand against persistent geopolitical tensions in the Middle East.
This remains an important risk factor for the equity markets. Changes in oil prices can affect inflation expectations, interest-rate expectations, transportation costs, corporate margins and investor risk appetite.
For the near term, traders should therefore follow both the technical charts and significant geopolitical developments. A sudden change in the Middle East situation could quickly alter market sentiment.
.
Key Takeaways for Traders and Investors
1. The overall U.S. market trend remains bullish.
The S&P 500, Nasdaq Composite and Russell 2000 remain comfortably above their 25-day, 50-day and 200-day moving averages.
2. Small-cap leadership is particularly encouraging.
The Russell 2000 continues to outperform the major large-cap indexes and is currently the strongest major index. Continued small-cap strength would provide additional evidence of broadening market participation.
3. Market internals remain healthy.
Advancers outnumbered decliners on both the NYSE and NASDAQ, while new 52-week highs continued to exceed new lows. The internal data therefore continue to support the bullish market trend.
4. Watch Nasdaq 26,650 closely.
This is becoming an important short-term resistance level. A decisive breakout could strengthen the bullish case, while repeated failures could lead to consolidation.
5. The AI, cloud, optical networking and memory groups deserve attention.
Wednesday produced powerful rebounds in several stocks that were heavily sold during the previous six weeks. These groups could offer trading opportunities if the rebounds develop into sustained technical recoveries.
6. Do not confuse a rebound with a confirmed trend reversal.
Several of Wednesday’s biggest winners still have damaged charts. Traders should look for follow-through, higher lows, improving moving averages and successful breaks of resistance before treating the moves as established new uptrends.
7. Geopolitical risk remains a major variable.
Developments involving the Middle East and oil markets could rapidly change the market’s direction. Technical strength should therefore be balanced with awareness of the broader fundamental and geopolitical environment.
Bottom Line
Wednesday’s session was constructive for U.S. equities. The major indexes generally advanced, market breadth remained positive, new highs continued to outnumber new lows, and small-cap stocks maintained their leadership.
The most interesting development for traders may be the combination of Russell 2000 strength and strong rebounds in previously beaten-down technology, AI, optical networking and memory stocks. If these groups can produce follow-through in the coming sessions, additional trading opportunities could emerge.
For now, the technical evidence continues to favor the bulls. Nevertheless, the Nasdaq’s approach to 26,650 resistance, the condition of previously damaged charts, and continuing Middle East geopolitical uncertainty are three factors traders should monitor closely.
.
NOTICE TO READERS
The Canadian Vanguard Stock Market is about empowering you to build and manage your wealth by yourself. There is certainly no magic in managing finances or wealth but one needs to know what to do and commit to doing what is needed. When you are ready to start the journey to Take Charge and Put Your Destiny In Your Own Hands, start with reading The Canadian Vanguard every market day. If and when you need more related information or to advertise your business products or services in The Canadian Vanguard, Contact Us
Our readers are strongly advised to conduct their own research into individual stocks before making a purchase decision. In addition, investors are advised that past stock performance is no guarantee of future price appreciation. Any recommendation is not a guarantee of any particular stock’s future prices, and The Canadian Vanguard accepts no responsibility or liability for investors’ or readers’ purchases.
Stocks In The News/ Stocks To Watch and Market Strategy will soon be available only to Paying Subscribers. The dollar sign “$” in the Toronto Market section in the articles only stands for Canadian dollar and in the US market section “$” stands for US dollar.
(c) This article is published by The Canadian Vanguard on August 12, 2026