
Semiconductor Rally Lifts NASDAQ and S&P 500 to Fresh Records
The Canadian Vanguard Stock Market Report Wednesday May 13, 2026 Edition
.
The Toronto Market
Today’s Toronto Market Index
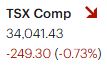
The S&P/TSX Composite Index fell 249.30 points, or 0.73%, to close at 34,041.43. The index declined after posting gains in each of the previous three sessions.
Weakness in the Energy and Basic Materials sectors — two key drivers of the TSX — weighed on the market today. Trading volume was also nearly 10% lower than yesterday’s level, suggesting some bullish investors may have remained on the sidelines.
Today’s TSX Market Internals
On the Toronto Stock Exchange, advancing issues outnumbered declining issues. There were 1,136 advancers and 1,023 decliners, resulting in an advancer-to-decliner ratio of 1.11-to-1, or roughly one advancing stock for every declining stock. Another 141 issues finished unchanged.
The exchange recorded 278 new 52-week highs and 54 new 52-week lows, compared with 124 new highs and 38 new lows yesterday.
Total trading volume on the TSX reached 451,126,556 shares, down 8% from yesterday’s 488,824,732 shares. Trading activity was slightly below the 50-day average daily volume, although positive market breadth remained encouraging for investors.
Daily trading volume has trended lower over the past three sessions following a sharp market sell-off four sessions ago, when trading volume surged significantly.
Today’s Toronto Market Wrap-Up Report
The Toronto market leaned bearish today as the S&P/TSX Composite Index declined 0.73%, with only two of the index’s ten major sectors finishing in positive territory. Healthcare gained 0.19%, while Utilities edged higher by 0.03%.
Most of the market’s heavyweight sectors closed lower. Energy slipped 0.09%, Telecommunications Services fell 0.12%, Basic Materials declined 0.23%, and Financials — one of the TSX’s most influential sectors — dropped 0.98%. Technology was once again the weakest-performing sector, falling 2.67% and extending its underperformance to a second consecutive session. Consumer-oriented groups such as Durable Consumer Goods & Services and Discretionary Goods & Services also struggled and finished only slightly ahead of the Technology sector.
Although the headline index was weaker, market internals painted a more balanced picture beneath the surface. Advancing issues on the TSX actually outnumbered declining issues, while new 52-week highs surged sharply from the previous session. That divergence suggests the broader market may still have underlying strength even as large-cap sectors, particularly Financials and Technology, pressured the index lower. For traders and investors, this type of action often signals selective rotation rather than broad-based market deterioration.
Trading volume declined from the previous session and remained slightly below the 50-day average daily volume. The lighter activity suggests some investors stayed cautious following the sharp sell-off seen earlier in the week. Lower volume on a down day is generally viewed as less damaging technically than a heavy-volume decline.
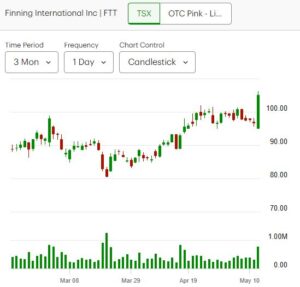
In company-specific news, Finning International Inc. (FTT) gapped higher on Wednesday after reporting stronger-than-expected earnings results. The stock climbed 8.70% to close at $104.97 on volume of 775,000 shares traded. The strong earnings reaction and increased investor interest make FTT a stock worth monitoring for potential momentum continuation.
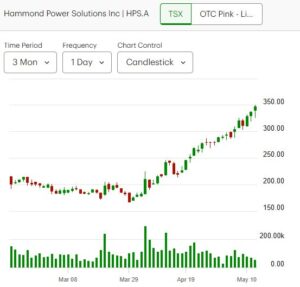
Hammond Power Solutions Inc. (HPS.A) was another standout performer. The stock advanced 2.98% to close at $347.20 with 54,860 shares traded. HPS.A continues to attract attention due to ongoing strength in electrification and infrastructure-related themes, areas that remain in focus for long-term growth investors.
Market Takeaway
Today’s decline in the TSX appears more like a pause driven by weakness in heavyweight sectors rather than a broad market breakdown. Positive market breadth and a sharp increase in new 52-week highs suggest investor appetite for selective opportunities remains intact, particularly in stocks showing earnings momentum and sector leadership.
.
The US Markets
Today’s U.S. Market Indexes
U.S. markets closed mixed today, reversing the order seen in yesterday’s session. The Dow Jones Industrial Average slipped 67.36 points, or 0.14%, to close at 49,693.20. Meanwhile, the S&P 500 advanced 43.29 points, or 0.58%, ending the session at 7,444.25.
The Nasdaq Composite gained 314.14 points, or 1.20%, to finish at 26,402.34, while the Russell 2000 Index edged up 1.10 points, or 0.04%, to close at 2,843.93.
Small-cap stocks slightly underperformed on Wednesday, although the Russell 2000 has continued to deliver strong performance so far in 2026. One weaker session is not enough to alter the broader positive trend, and the index continues to display solid momentum.

Today’s U.S. Market Statistics
New York Stock Exchange (NYSE): Market breadth on the NYSE was negative today, as declining issues outnumbered advancing issues. There were 2,407 decliners versus 1,991 advancers, while 412 stocks finished unchanged. This produced a decliner-to-advancer ratio of 1.21-to-1, or roughly six declining stocks for every five advancing stocks.
Despite the weaker breadth, momentum in individual stocks remained constructive. The exchange recorded 433 new 52-week highs compared with 175 new 52-week lows, a notable improvement from yesterday’s 199 new highs and 125 new lows. The sharp increase in new highs suggests institutional money continues to rotate into leadership stocks even as the broader market experiences selective profit-taking.
Total NYSE trading volume reached 5.89 billion shares, up 2% from yesterday’s 5.76 billion shares traded. The modest increase in volume alongside negative breadth points to a more defensive trading session, with investors reducing exposure in weaker sectors while continuing to accumulate select large-cap leaders.
NASDAQ: NASDAQ market breadth was also slightly negative, although conditions remained relatively balanced. Declining stocks totaled 2,467 while advancing stocks reached 2,327, resulting in a decliner-to-advancer ratio of 1.06-to-1. Another 372 issues closed unchanged.
Internally, the technology-heavy exchange continued to display resilience. NASDAQ posted 290 new 52-week highs and 233 new 52-week lows, compared with 113 new highs and 194 new lows yesterday. The sharp rise in new highs indicates continued strength in growth-oriented and momentum-driven names, particularly within artificial intelligence, semiconductor, and software-related sectors.
Total NASDAQ trading volume reached 10.14 billion shares, essentially unchanged from yesterday’s 10.01 billion shares. Stable volume combined with only mildly negative breadth suggests traders remain engaged in the market, although participation appears concentrated in a narrower group of outperforming stocks rather than across the broader exchange.
Today’s U.S. Market Wrap-Up Report
U.S. markets closed mixed today, with leadership once again concentrated in large-cap technology and growth stocks. The Dow Jones Industrial Average slipped 0.14% after posting gains in five of the previous six sessions, while the Nasdaq Composite continued its powerful advance and returned firmly to record territory. The NASDAQ reached an intraday all-time high of 26,474.18 before finishing slightly below that level at a still-record closing high of 26,402.34.
Sector performance reflected the market’s ongoing preference for growth-oriented themes. Only five of the ten major sectors closed higher, led by Technology, which gained 1.41%. Consumer-focused areas also showed strength, with Discretionary Consumer Goods & Services rising 0.78% and Durable Consumer Goods & Services advancing 0.13%. Healthcare added 0.65%, while Basic Materials edged up 0.09%.
Defensive and income-oriented sectors underperformed. Financials and Telecommunications Services closed lower, while Utilities fell 1.20%, making it the weakest sector of the session. The rotation away from defensive sectors and toward high-growth technology names suggests investors remain willing to take on risk as momentum in artificial intelligence, cloud infrastructure, and semiconductor-related stocks continues to strengthen.
Market internals, however, revealed a more selective rally beneath the surface. On both the New York Stock Exchange and NASDAQ, declining stocks slightly outnumbered advancing stocks. Despite the negative breadth, both exchanges posted a sharp increase in new 52-week highs compared with the previous session. That divergence indicates institutional capital remains concentrated in market leaders rather than broadly distributed across all sectors and stocks. For traders, this type of environment often rewards momentum and relative strength strategies while punishing weaker or lagging names.
In company news, the optoelectronics industry continued to outperform as investor demand for AI infrastructure and data-center connectivity remained strong. Applied Optoelectronics Inc. (AAOI) surged 18.49% to close at $223.10 on heavy volume of 18.4 million shares traded. Corning Incorporated (GLW) gained 4.17% to close at $206.51 with 15.4 million shares traded, continuing the sector’s strong momentum.
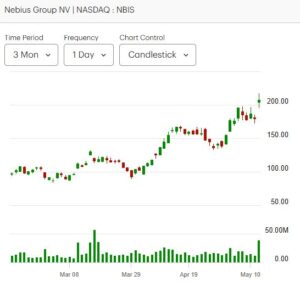
Within the cloud infrastructure and AI data-center space, Nebius Group (NBIS) emerged as one of the market’s standout performers. The company delivered earnings that exceeded analyst expectations and announced plans for a new Pennsylvania data center with 1.2 gigawatts of capacity. Management also raised guidance for contracted power capacity to 4 gigawatts by year-end, reinforcing expectations for aggressive expansion in AI infrastructure demand. NBIS shares jumped 15.72%, closing at $207.27 on exceptionally strong volume of 38.8 million shares traded. The stock is increasingly positioning itself as a potential leadership name within the cloud and AI infrastructure space and may be worth monitoring for continued momentum.
Fabrinet also delivered a strong performance, climbing 9.71% on volume of 1.1 million shares traded. The stock has experienced elevated volatility throughout the year, but continued strength in optical networking and AI-related hardware demand has kept investor interest elevated.
Market Takeaway
Today’s session reinforced a theme that has dominated much of 2026: leadership remains concentrated in technology, AI infrastructure, semiconductors, and high-growth cloud-related names. While broader market breadth remains mixed, the sharp rise in new 52-week highs suggests institutional investors are continuing to aggressively accumulate perceived market leaders. As long as capital continues flowing into growth and momentum stocks, the NASDAQ may remain supported near record levels, although narrower participation beneath the surface could increase volatility if leadership begins to weaken.
.
NOTICE TO READERS
The Canadian Vanguard Stock Market is about empowering you to build and manage your wealth by yourself. There is certainly no magic in managing finances or wealth but one needs to know what to do and commit to doing what is needed. When you are ready to start the journey to Take Charge and Put Your Destiny In Your Own Hands, read The Canadian Vanguard every market day. If you need more related information, Contact Us
Our readers are strongly advised to conduct their own research into individual stocks before making a purchase decision. In addition, investors are advised that past stock performance is no guarantee of future price appreciation. Any recommendation is not a guarantee of any particular stock’s future prices, and The Canadian Vanguard accepts no responsibility or liability for investors’ or readers’ purchases.
Stocks In The News/ Stocks To Watch and Market Strategy will soon be available but only to Paying Subscribers. The dollar sign “$” in the Toronto Market section in the articles only stands for Canadian dollar and in the US market section “$” stands for US dollar.
(c) This article is published by The Canadian Vanguard on May 13, 2026