Stocks Slide as Doubts Grow Over U.S.–Iran Peace Deal
The Canadian Vanguard Stock Market Report Thursday May 7, 2026 Edition
.
The Toronto Market
Today’s Toronto Market Index
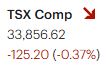
The Toronto S&P/TSX Composite Index fell 125.20 points, or 0.37%, to close at 33,856.62, giving back roughly one-third of yesterday’s gains. Despite the decline, the TSX remains within 300 points of its 52-week high. Trading volume was 4% below yesterday’s level, although yesterday’s volume was above the 50-day average. Overall, the Toronto market posted a generally negative performance today.
Today’s TSX Market Internals
On the TSX, declining issues outnumbered advancing issues, reflecting broadly negative market breadth. There were 1,442 decliners compared with 749 advancers, resulting in a decliner-to-advancer ratio of 1.92 to 1 — nearly two declining stocks for every advancing stock. Another 134 issues closed unchanged.
The exchange recorded 311 new 52-week highs and 42 new 52-week lows, compared with 394 new highs and 32 new lows yesterday.
Total trading volume on the TSX reached 561,364,146 shares, down 4% from yesterday’s 584,340,775 shares. Although trading activity eased from yesterday’s elevated level, today’s volume remained slightly above the 50-day average daily trading volume.
Today’s Toronto Market Wrap-Up Report
The Toronto market delivered a mixed but generally weaker session, with defensive positioning and selective technology strength offset by broad-based selling pressure across cyclical sectors. Only three sectors finished in positive territory, highlighting cautious investor sentiment as traders locked in profits following recent market gains.
Technology led the market higher with a strong 5.37% advance, driven primarily by strength in large-cap growth names. Telecommunications followed with a modest 0.93% gain, while Durable Consumer Goods & Services added 0.82%. Despite these pockets of strength, overall market breadth remained negative. Financials slipped 0.26%, while the weakest sectors were Industrials (-1.16%), Basic Materials (-1.04%), and Energy (-0.99%), reflecting softer risk appetite and pressure on economically sensitive stocks.
For active investors and traders, today’s session reinforced the market’s current rotation toward selective growth leadership while cyclicals continue to lose momentum near resistance levels. The TSX remains close to its 52-week high, but weakening breadth and declining participation suggest traders should remain disciplined with position sizing and closely monitor leadership stocks for continuation signals.
In company-specific trading, Shopify Inc. (SHOP) stood out as the day’s strongest technology performer. The stock climbed 5.73% to close at $152.57 on volume of 2.89 million shares, with trading activity running above its 50-day average. The move signals renewed institutional interest after recent weakness. However, SHOP remains below its 200-day moving average, meaning longer-term technical damage has not yet been fully repaired. Momentum traders may continue to monitor the stock for follow-through buying and a sustained move back above major resistance levels before confirming a stronger trend reversal.
Celestica Inc. (CLS), another key TSX technology name, moved sharply lower, falling 7.5% to close at $524.62. Despite today’s decline, the stock remains well above both its 50-day and 200-day moving averages, indicating the broader uptrend remains intact. Technically, today’s selloff brought the stock close to its 25-day moving average, an area traders may watch closely for potential support or further downside acceleration if selling pressure continues.
Financial stocks also attracted attention during the session as two major Canadian banks briefly traded at new 52-week highs before reversing lower into the close — a potential sign of near-term exhaustion after strong recent advances. Toronto-Dominion Bank (TD) traded as high as $149.08, surpassing its previous 52-week high of $148.74, but finished the day at $147.13. Similarly, Royal Bank of Canada (RY) reached an intraday high of $249.13, exceeding its prior 52-week high of $248.33, before closing 1.3% lower at $247.64.
For traders, these intraday reversals in leadership financial names could indicate short-term profit taking near resistance levels. Investors, however, may interpret the ability of major banks to challenge new highs as a sign that institutional money flow into Canadian financials remains constructive despite near-term volatility.
.
The US Markets
Today’s U.S. Market Indexes
U.S. equity markets closed lower across the board today as investors paused following yesterday’s strong rally in large-cap stocks. Profit taking, combined with cautious positioning near record highs, contributed to a broadly weaker session, although the pullback in major technology indexes remained relatively modest.
The Dow Jones Industrial Average declined 313.62 points, or 0.63%, to close at 49,596.97. The S&P 500 fell 28.01 points, or 0.38%, ending the session at 7,337.11, while the Nasdaq Composite slipped 32.75 points, or 0.13%, to finish at 25,806.20. The sharpest weakness appeared in smaller-cap equities, with the Russell 2000 dropping 47.15 points, or 1.63%, to close at 2,839.63.
For investors and traders, today’s action appears more consistent with consolidation than a major change in market trend. The Dow Jones and S&P 500 gave back a portion of yesterday’s gains after advancing into elevated territory, while the Nasdaq showed relative strength by posting only a modest decline. Pullbacks of this nature are common after extended rallies, particularly when indexes are trading near or at record highs.
Technology and large-cap growth stocks continue to demonstrate resilience, suggesting institutional capital remains concentrated in market leadership names. However, the sharp decline in the Russell 2000 indicates risk appetite weakened considerably beneath the surface, with smaller-cap stocks facing heavier selling pressure. That divergence between large-cap leadership and small-cap weakness is an important signal traders should continue monitoring closely.
From a technical perspective, the broader market trend remains constructive, but momentum indicators are becoming increasingly stretched after recent advances. Traders may view today’s decline as a healthy pause that could help reset short-term sentiment before the next directional move develops. Investors, meanwhile, may continue focusing on leadership sectors and high relative-strength stocks while remaining selective with new entries as volatility near record highs increases.

Today’s U.S. Market Statistics
Market internals weakened noticeably across both major U.S. exchanges today, reinforcing the broader pullback seen in the major indexes. Declining stocks significantly outpaced advancing stocks on both the NYSE and NASDAQ, suggesting selling pressure was broad-based rather than limited to a handful of sectors.
New York Stock Exchange (NYSE): On the NYSE, decliners outnumbered advancers by a wide margin. There were 2,830 declining issues compared with 1,537 advancing issues, while 449 stocks closed unchanged. This produced a decliner-to-advancer ratio of approximately 1.84 to 1 — roughly two declining stocks for every advancing stock.
The exchange recorded 403 new 52-week highs and 82 new 52-week lows, compared with 725 new highs and 92 new lows yesterday. The sharp drop in new highs suggests upside momentum slowed considerably following the market’s recent rally. However, the relatively contained number of new lows indicates broad technical deterioration has not yet fully developed.
NYSE trading volume totaled 6.44 billion shares, down 5% from yesterday’s 6.75 billion shares traded. The lighter volume during today’s decline may indicate the selling pressure was more consistent with profit taking and consolidation rather than aggressive institutional distribution.
NASDAQ: Market breadth on the NASDAQ was similarly weak, with declining stocks outnumbering advancing stocks by nearly two to one. The exchange reported 3,101 decliners and 1,738 advancers, while 330 issues finished unchanged, resulting in a decliner-to-advancer ratio of 1.78 to 1.
The NASDAQ posted 354 new 52-week highs and 109 new 52-week lows, compared with 434 new highs and 119 new lows yesterday. Although the number of new highs declined, leadership in growth and technology stocks continues to hold up relatively well compared with the broader market.
Total NASDAQ trading volume reached 9.48 billion shares, up 3% from yesterday’s 9.17 billion shares traded. The increase in volume alongside a modest decline in the Nasdaq Composite suggests traders remained active in large-cap technology and momentum stocks despite broader market weakness.
Investor and Trader Takeaway
For investors and active traders, today’s market internals point to a short-term cooling phase after the strong upside momentum seen recently. Breadth weakened significantly, and the decline in new 52-week highs on both exchanges indicates participation narrowed as indexes approached elevated levels.
At the same time, the relatively limited expansion in new lows suggests the broader bullish trend has not yet materially broken down. Traders may continue focusing on relative-strength leaders and stocks maintaining support above key moving averages, while investors may interpret the current pullback as a normal consolidation phase within a still-constructive longer-term trend.
U.S. Market Wrap-Up Report
U.S. equity markets pulled back modestly today as investors reacted to renewed geopolitical uncertainty surrounding developments in the Middle East and growing doubts over a potential U.S.–Iran peace agreement. While headline indexes weakened, the overall tone of the session suggested more of a controlled consolidation phase rather than the start of a deeper risk-off move.
The Dow Jones Industrial Average experienced the heaviest pressure among the major indexes, while the S&P 500 posted only a moderate decline and the Nasdaq Composite showed relative resilience with a modest 0.13% pullback. Small-cap stocks, however, came under considerably heavier selling pressure, with the Russell 2000 dropping 1.6%, signaling a noticeable reduction in investor risk appetite beneath the surface of the broader market.
All major sectors finished lower, though losses remained relatively orderly without signs of panic selling or widespread institutional liquidation. Technology once again demonstrated leadership characteristics, declining only 0.09% and outperforming the broader market. Utilities were the weakest sector, falling 2.27%, as investors rotated away from defensive positioning following recent strength in the group.
For investors and traders, today’s market action appears consistent with a healthy pause after a strong multi-session advance. Pullbacks of this nature are common when indexes are trading near record territory, particularly amid geopolitical uncertainty. The absence of aggressive downside momentum and the continued resilience of technology leadership suggest the broader bullish trend remains intact for now. However, weakness in small caps and broad negative market breadth indicate traders should remain selective and closely monitor whether leadership stocks continue to hold support levels.
Key Company and Sector Developments
Applovin Corporation emerged as one of the market’s standout performers following strong quarterly results. The company reported adjusted first-quarter earnings of $3.56 per share, while revenue surged 59% year-over-year to $1.56 billion. Management also issued strong second-quarter guidance, projecting revenue between $1.92 billion and $1.95 billion. The earnings report reinforced investor confidence in continued growth within the digital advertising and AI-driven software space, helping fuel strong momentum in the stock.
In contrast, memory and disk-drive manufacturing stocks experienced notable profit taking after several weeks of strong outperformance. The group had become technically extended, making today’s pullback relatively expected from a trading perspective.
Sandisk Corporation declined 4.9% on elevated trading volume, while Western Digital Corporation (WDC) fell 3.98%. Micron Technology slipped 3.02%, and Seagate Technology Holdings dropped 2.54%. Despite today’s weakness, the broader longer-term trend in the storage and memory segment remains constructive, particularly given ongoing AI-related infrastructure demand. Traders may now watch for stabilization near short-term support zones before considering new entries.
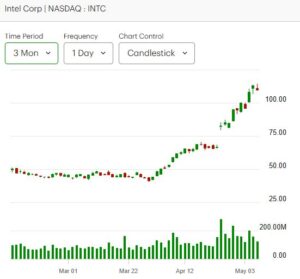
Semiconductor stocks delivered mixed performance but continued to attract strong trading activity. Intel (INTC) surged 13% and closed at $108.15 on exceptionally heavy volume of nearly 200 million shares traded. The stock has rallied sharply since closing at $66.78 on April 23, signaling aggressive momentum buying and renewed speculative interest.
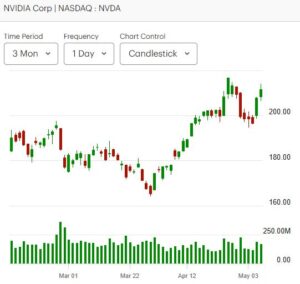
Nvidia Corp (NVDA) extended its recent advance with a 1.9% gain following yesterday’s strong 5.8% rally, reinforcing its role as one of the market’s primary leadership stocks. Continued strength in Nvidia remains important for overall market sentiment given its outsized influence on both the semiconductor sector and broader technology indexes.
Advanced Micro Devices (AMD), which rallied 15% following strong quarterly earnings earlier this week, pulled back 1.8% today as traders locked in short-term profits. ARM Holdings experienced sharper selling pressure, declining 10%, highlighting the elevated volatility currently present in high-growth semiconductor names.
Within the optoelectronics segment, Lumentum Holdings fell 5.45% on active volume, reflecting continued volatility across networking and communications infrastructure stocks.
Investor and Trader Takeaway
Today’s session reinforced several important market themes for active investors and traders:
- Large-cap technology continues to show relative strength and remains the market’s leadership group.
- Small-cap weakness suggests investors are becoming more selective and cautious with risk exposure.
- Profit taking is emerging in highly extended AI, semiconductor, and storage-related stocks, though broader uptrends largely remain intact.
- Geopolitical headlines continue to influence short-term market direction and could increase volatility in the near term.
For now, the broader market structure still favors a bullish intermediate-term outlook, but traders may benefit from tighter risk management as momentum becomes increasingly concentrated in a smaller group of leadership stocks.
.
NOTICE TO READERS
The Canadian Vanguard Stock Market is about empowering you to build and manage your wealth by yourself. There is certainly no magic in managing finances or wealth but one needs to know what to do and commit to doing what is needed. When you are ready to start the journey to Take Charge and Put Your Destiny In Your Own Hands, read The Canadian Vanguard every market day. If you need more related information, Contact Us
Our readers are strongly advised to conduct their own research into individual stocks before making a purchase decision. In addition, investors are advised that past stock performance is no guarantee of future price appreciation. Any recommendation is not a guarantee of any particular stock’s future prices, and The Canadian Vanguard accepts no responsibility or liability for investors’ or readers’ purchases.
Stocks In The News/ Stocks To Watch and Market Strategy will soon be available but only to Paying Subscribers. The dollar sign “$” in the Toronto Market section in the articles only stands for Canadian dollar and in the US market section “$” stands for US dollar.
(c) This article is published by The Canadian Vanguard on May 7, 2026