







Wall Street Rallies Sharply After U.S. Midterm Elections as Oil Prices Slide and Treasury Yields Retreat
The Canadian Vanguard Stock Market Report Wednesday, November 4, 2026, Edition
.
The Toronto Market
Wednesday’s Toronto Market Index
The S&P/TSX Composite Index rallied 809.12 points, or 2.28%, to close at 36,341.40.
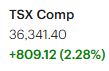

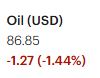
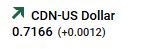
The TSX posted a strong performance today, one day after the U.S. midterm elections. The index opened firmly and continued to advance throughout the trading session, ultimately closing well above its session low. It also crossed the psychologically important 36,000 level and finished comfortably above it.
With the U.S. midterm elections now behind us, today’s market performance was encouraging. However, one positive trading session is not sufficient to confirm the beginning of a new market uptrend. Investors and traders should remain cautious and wait for further confirmation from the market before making significant changes to their investment positions.
Market breadth was positive today, indicating broad-based participation in the market’s advance. Nevertheless, investors should continue to take appropriate steps to protect their capital and manage risk. For now, maintaining market exposure at approximately 50% to 70% of portfolio value may be a prudent approach while waiting to see whether the market can establish and sustain a new upward trend.
From a technical perspective, despite today’s strong rally, the TSX Composite Index remains slightly below both its 25-day and 50-day moving averages. Encouragingly, however, it continues to trade comfortably above its 200-day moving average.
Market Outlook: Today’s strong advance is encouraging, but confirmation of a sustainable change in market direction is still needed. Capital preservation, disciplined risk management, and measured market exposure should therefore remain priorities.
Wednesday’s TSX Market Statistics
At the TSX, advancing issues significantly outnumbered declining issues. Specifically, there were 1,807 advancing issues compared with 524 declining issues, producing an advancer-to-decliner ratio of 3.45 to 1, or approximately seven advancers for every two decliners. An additional 105 issues closed unchanged.
Market breadth was positive, reflecting broad participation in the market’s advance. However, the market’s internal indicators remain mixed and require continued monitoring.
The exchange recorded 27 new 52-week highs and 19 new 52-week lows, compared with 8 new 52-week highs and 26 new 52-week lows in the previous session.
Although the number of new 52-week highs increased substantially, the number of new 52-week lows also declined. The ratio of new 52-week highs to new 52-week lows improved to approximately 1.42 to 1, compared with approximately 0.31 to 1 in the previous session. This represents a notable improvement in the market’s longer-term internal strength. Nevertheless, further improvement over subsequent sessions will be necessary to establish a sustainable positive trend.
Total trading volume on the TSX reached 645,905,000 shares. This represented a substantial increase compared with the reported previous-session volume of 405,610,000 shares.
Volatility remains a significant feature of the current market environment, and investors should not expect it to disappear anytime soon. We must continue to monitor the market’s internal indicators closely to identify any meaningful change in direction as early as possible.
In particular, a sustained reversal in the relationship between new 52-week highs and new 52-week lows will be important. For the market’s internal indicators to strengthen meaningfully, new 52-week highs should consistently outnumber new 52-week lows.
Market Outlook: Today’s statistics show an encouraging improvement in market breadth and the new-high/new-low relationship. However, one session does not establish a lasting trend. Investors should remain vigilant, maintain disciplined risk management, and continue to monitor market internals for confirmation of a sustainable improvement.
Wednesday’s Toronto TSX Market Wrap-Up Report
A Strong Day for the Toronto Market as the TSX Rallies 2.28%
The Toronto stock market delivered an impressive performance on Wednesday, with the S&P/TSX Composite Index surging 809.12 points, or 2.28%, to close at 36,341.40. It was a broadly positive trading session, with advancing issues significantly outnumbering declining issues.
The TSX opened strongly and maintained its upward momentum throughout the session, eventually closing comfortably above the psychologically important 36,000 level. Market breadth was particularly encouraging, with 1,807 advancing issues compared with 524 declining issues, producing an advancer-to-decliner ratio of 3.45 to 1. An additional 105 issues closed unchanged.
Despite the impressive advance, investors should exercise some caution. One strong trading session does not necessarily signal the beginning of a sustainable market uptrend. The index also remains slightly below its 25-day and 50-day moving averages, although it continues to trade comfortably above its 200-day moving average.
Sector Performance: Technology and Consumer Stocks Lead the Advance
Technology Services was the top-performing sector in the Toronto market on Wednesday, surging 14.33%. Retail followed with an impressive gain of 13.49%, while Health Technology advanced 10.92%. Communications gained 9.13%, Utilities rose 8.35%, and Finance advanced 5.81%.
On the downside, Electronic Technology was the weakest-performing sector, falling 23.85%. Distribution Services also struggled, declining 9.02%.
The substantial gains in several sectors contributed to the market’s positive performance. However, the sharp declines in Electronic Technology and Distribution Services demonstrate that considerable volatility and stock-specific weakness remain in the market.
Canada’s Big Six Banks: All Six Finish Higher
Canadian banking stocks participated in Wednesday’s rally, with all six of Canada’s major banks recording gains of at least 2%.
Bank of Montreal (BMO) was the top performer among the Big Six, advancing 2.93% to close at $247.61, with 4.4 million shares traded.
National Bank of Canada (NA) gained 2.79%, closing at $218.96, with 1.4 million shares traded. The Bank of Nova Scotia (BNS) advanced 2.54% to $134.50, with 4.6 million shares traded.
Royal Bank of Canada (RY) rose 2.51% to close at $292.57, with 2.5 million shares traded. Toronto-Dominion Bank (TD) gained 2.39%, with 4.5 million shares traded. Canadian Imperial Bank of Commerce (CM) advanced approximately 2.30% to close at $167.24, with 4.6 million shares traded.
The broad-based strength across Canada’s major banks was an encouraging development for the financial sector and contributed to the positive tone of Wednesday’s market session.
Gold Stocks Rally as Gold Prices Advance
Gold prices moved higher on Wednesday, providing support for several major Canadian-listed gold and precious metals companies.
Agnico Eagle Mines (AEM) advanced 9.45% to close at $256.31, with 1.4 million shares traded. Franco-Nevada (FNV) gained 6.92%, closing at $338.47, with 863,600 shares traded.
Wheaton Precious Metals (WPM) was particularly strong, rallying 11.66% to finish at $183.73, with 1.6 million shares changing hands. Kinross Gold (K) also performed well, advancing 7.51% to close at $29.91, with 9.7 million shares traded.
The strength in these gold-related stocks is worth watching, particularly if gold prices maintain their upward momentum. Traders should monitor whether the buying interest continues over the next several sessions.
🔒 Premium Content
You must be a subscriber to access the remaining parts of this section. Current subscription rate is $60 CAD for a year
Login or Subscribe
Final Market Outlook
Wednesday’s trading session was a welcome development for the Toronto market. The TSX recorded a substantial gain, market breadth was positive, trading volume increased, and the relationship between new 52-week highs and new 52-week lows improved considerably.
These developments suggest that buying interest is returning to the market. Nevertheless, investors should avoid becoming overly optimistic after just one strong session.
The next few trading sessions will be important in determining whether Wednesday’s advance represents the beginning of a more sustainable recovery or simply another temporary rally within a volatile market environment.
For now, traders and investors should remain selective, closely monitor market internals, and resist the temptation to chase stocks simply because they have experienced substantial one-day gains.
The priority remains capital preservation while staying positioned to take advantage of opportunities should the market establish a confirmed and sustainable upward trend.
.
The US Markets
Wednesday’s U.S. Market Indexes
Wall Street Rallies Strongly as Dow Jones Surges More Than 3%
The major U.S. stock market indexes finished Wednesday’s trading session firmly in positive territory, delivering an impressive broad-based rally.
The Dow Jones Industrial Average surged 1,569.40 points, or 3.03%, to close at 53,356.12. The S&P 500 advanced 119.70 points, or 1.58%, finishing at 7,688.62. The Nasdaq Composite gained 364.50 points, or 1.44%, to close at 25,736.51. Meanwhile, the Russell 2000 jumped 44.50 points, or 1.58%, ending the session at 2,856.95.

It was an exceptionally strong trading session on Wall Street, with all four major indexes recording substantial gains. The market displayed the characteristics of a rising tide lifting most boats, as buying interest extended across the broader market.
The indexes opened positively, advanced throughout the session, and closed well above their respective session lows. This was an encouraging indication of sustained buying interest during the trading day.
For traders who had established positions at lower prices, Wednesday’s rally presented an opportunity to take profits in keeping with the timeless trading principle of buying low and selling high. However, investors should avoid assuming that one strong session signals the beginning of a sustained upward trend.
Dow Jones Leads the Major Indexes
The Dow Jones Industrial Average was Wednesday’s standout performer, gaining an impressive 3.03%. A daily advance of this magnitude is relatively unusual for the blue-chip index and reflects substantial buying interest in large-cap stocks.
The Dow’s strong performance also indicates that investors were willing to move back into some of the market’s major established companies.
From a technical perspective, the Dow Jones has now recovered and moved back above its 21-day, 50-day, and 200-day moving averages. This is an encouraging development and suggests that its technical position has strengthened considerably.
Traders should monitor whether the index can maintain its position above these important moving averages in the coming sessions.
S&P 500 Strengthens Its Technical Position
The S&P 500 also delivered a solid performance, advancing 1.58% to close at 7,688.62.
The index finished Wednesday above both its 25-day and 50-day moving averages and remains comfortably above its 200-day moving average.
This is a positive technical development, as the index has strengthened its position relative to these important trend indicators.
A sustained move above the shorter-term moving averages would provide additional evidence that the broader market is regaining upward momentum.
Nasdaq Continues to Lag Behind
Although the Nasdaq Composite advanced 1.44% on Wednesday, it continues to lag behind the Dow Jones and remains in a relatively weaker technical position.
Encouragingly, the Nasdaq has now recorded two consecutive sessions of reasonably strong gains. This could indicate that buying interest is beginning to return to technology and growth-oriented stocks.
However, the index remains clearly below its 21-day and 50-day moving averages, although it continues to trade above its 200-day moving average.
The Nasdaq therefore has more technical ground to recover before its overall technical picture can be considered convincingly positive.
Investors should watch closely to see whether the index can regain and sustain its position above its shorter-term moving averages.
Russell 2000: Small-Cap Stocks Still Face Challenges
The Russell 2000 advanced 1.58% to close at 2,856.95, participating in Wednesday’s broader market rally.
Despite the gain, the small-cap index remains below its 25-day, 50-day, and 200-day moving averages.
This is an important technical distinction because it suggests that small-cap stocks have not yet experienced the same degree of technical recovery as the Dow Jones and S&P 500.
Traders should continue monitoring the Russell 2000 for signs of improving relative strength. A sustained recovery above its major moving averages would provide more convincing evidence that the rally is extending into the small-cap segment of the market.
Key Takeaways for Traders and Investors
Wednesday’s rally was encouraging, but the four major indexes are not yet displaying equally strong technical conditions.
- Dow Jones is leading the recovery. Its 3.03% advance and move above its 21-day, 50-day, and 200-day moving averages represent a significant technical improvement.
- The S&P 500 is also strengthening. Its position above the 25-day, 50-day, and 200-day moving averages is encouraging and deserves continued attention.
- Nasdaq needs further improvement. Two consecutive positive sessions are encouraging, but the index must recover its shorter-term moving averages to demonstrate stronger technical momentum.
- Russell 2000 remains vulnerable. Its position below all three major moving averages suggests that small-cap stocks continue to face technical challenges.
- Avoid chasing the rally. Traders who purchased stocks at lower levels may consider taking partial profits, particularly in stocks that have advanced sharply. New positions should be approached selectively, with attention to entry prices and risk.
Final U.S. Market Outlook
Wednesday was an impressive day for Wall Street. All four major indexes advanced, with the Dow Jones leading the rally by a considerable margin. The S&P 500 also strengthened its technical position, while the Nasdaq recorded a second consecutive session of gains.
Nevertheless, the technical picture remains uneven. The Dow Jones and S&P 500 are showing encouraging signs of recovery, but the Nasdaq and Russell 2000 still have important technical hurdles to overcome.
The coming trading sessions will be important in determining whether Wednesday’s rally can develop into a more sustainable upward trend.
For now, traders and investors should remain disciplined, avoid chasing sharp one-day advances, and continue to prioritize capital preservation while watching for further confirmation from the major indexes.
.
Wednesday’s U.S. Market Statistics
NYSE and NASDAQ Market Internals Show Encouraging Improvement, but More Work Remains
Wednesday’s U.S. market statistics showed considerable improvement across both the New York Stock Exchange (NYSE) and NASDAQ. Advancing issues significantly outnumbered declining issues on both exchanges, trading volume increased, and the relationship between new 52-week highs and new 52-week lows improved.
These developments provide encouraging evidence that buying interest is returning to the market. However, the market’s internal indicators have been weakened over an extended period, and one positive trading session will not be sufficient to repair all the damage.
Let’s examine the market statistics from both exchanges.
1. New York Stock Exchange (NYSE)
Market Breadth: Strongly Positive
At the NYSE, advancing issues significantly outnumbered declining issues. Specifically, there were 2,081 advancing issues compared with 655 declining issues, while 36 issues closed unchanged.
This produced an advancer-to-decliner ratio of approximately 3.17 to 1, meaning that there were slightly more than three advancing stocks for every declining stock.
This is a strong market-breadth reading and indicates that Wednesday’s market advance was supported by broad participation among NYSE-listed stocks.
New 52-Week Highs and Lows: Significant Improvement
The NYSE recorded 148 new 52-week highs and 97 new 52-week lows on Wednesday.
This compares with 38 new 52-week highs and 128 new 52-week lows recorded on Tuesday.
The improvement was substantial:
- New 52-week highs increased by approximately 289% compared with Tuesday.
- New 52-week lows decreased by approximately 24%.
- The ratio of new 52-week highs to new 52-week lows improved to approximately 1.53 to 1, compared with approximately 0.30 to 1 on Tuesday.
This is a particularly encouraging development. For the first time in this two-session comparison, new 52-week highs substantially outnumbered new 52-week lows.
The improvement suggests that the NYSE’s internal indicators strengthened considerably on Wednesday. Nevertheless, the market internals have been weak for some time, and additional positive sessions will be needed before we can conclude that a sustainable recovery has taken hold.
A few more sessions with similar improvements could go a long way toward repairing the damage to the market’s internal indicators and restoring investor confidence.
Trading Volume: A Significant Increase
Total NYSE trading volume reached 7,523,349,907 shares, approximately 34.6% higher than Tuesday’s volume of 5,591,088,446 shares.
The substantial increase in trading activity is encouraging, particularly given Wednesday’s strong market advance.
Higher volume accompanying rising stock prices can indicate stronger participation and provide additional support for the rally. However, volume should always be considered alongside price action and market breadth rather than viewed in isolation.
NYSE Market Assessment
The NYSE delivered a strong improvement in its market internals on Wednesday. The advancer-to-decliner ratio was impressive, new 52-week highs significantly outnumbered new lows, and trading volume increased substantially.
However, the market’s internal indicators remain in need of further repair. Investors and traders should not interpret Wednesday’s improvement as confirmation that the market has returned to a healthy and sustainable bullish condition.
For now, extreme caution remains appropriate. Traders should continue managing their positions carefully, maintaining appropriate stop-loss levels, and remaining prepared to reduce exposure or exit positions if market conditions deteriorate.
2. NASDAQ
Market Breadth: Positive
NASDAQ also recorded positive market breadth on Wednesday.
There were 3,307 advancing issues compared with 1,634 declining issues, while 165 issues closed unchanged.
This produced an advancer-to-decliner ratio of approximately 2.02 to 1, meaning that there were approximately two advancing stocks for every declining stock.
This is an encouraging reading and indicates that Wednesday’s market advance extended across a substantial portion of NASDAQ-listed stocks.
New 52-Week Highs and Lows: Improvement, but Weakness Remains
NASDAQ recorded 253 new 52-week highs and 298 new 52-week lows on Wednesday.
This compares with 81 new 52-week highs and 311 new 52-week lows recorded on Tuesday.
The comparison shows the following improvements:
- New 52-week highs increased by approximately 213% compared with Tuesday.
- New 52-week lows decreased by approximately 4%.
- The ratio of new 52-week highs to new 52-week lows improved to approximately 85%, compared with approximately 26% on Tuesday.
Although the relationship between new highs and new lows improved considerably, new 52-week lows continued to outnumber new 52-week highs.
This is an important distinction. Unlike the NYSE, NASDAQ has not yet reached the point where new 52-week highs consistently outnumber new 52-week lows.
NASDAQ’s market internals therefore remain relatively weak, despite Wednesday’s improvement.
The substantial increase in new 52-week highs is encouraging and suggests that some stocks are beginning to recover. However, the continued presence of a relatively large number of new 52-week lows indicates that underlying weakness has not disappeared.
We will need several more positive trading sessions, with improving market breadth and a better relationship between new highs and new lows, before NASDAQ’s internal indicators can be considered adequately repaired.
Trading Volume: Stronger Participation Supports the Advance
NASDAQ trading volume reached 10,257,385,928 shares on Wednesday, compared with 8,766,700,525 shares on Tuesday.
This represents an increase of approximately 17%.
The increase in trading volume, combined with Wednesday’s advance in the Nasdaq Composite Index, is encouraging. It suggests that the upward move attracted greater trading participation and was supported by stronger activity.
Nevertheless, one session of increased volume does not establish a lasting change in market direction.
Traders should continue watching whether NASDAQ can maintain its upward momentum and whether improving volume is accompanied by sustained improvements in market breadth and the new-high/new-low relationship.
NASDAQ Market Assessment
NASDAQ’s market internals showed some improvement on Wednesday, but the exchange continues to face underlying weakness.
The positive advancer-to-decliner ratio, substantial increase in new 52-week highs, and higher trading volume are encouraging developments.
However, the fact that new 52-week lows still outnumber new 52-week highs tells us that the recovery remains incomplete.
NASDAQ needs more consecutive positive sessions to strengthen its internal indicators and restore investor confidence in the market’s ability to sustain a consistent upward trend.
Traders and investors should therefore continue monitoring NASDAQ closely. We will be watching for further improvements in market breadth, trading volume, and the relationship between new 52-week highs and new 52-week lows.
3. Key Takeaways for Traders and Investors
Wednesday’s statistics provide reasons for cautious optimism, but there is still considerable work to be done before the market’s internal indicators can be considered fully repaired.
1. Market breadth improved significantly on both exchanges.
The NYSE recorded an advancer-to-decliner ratio of 3.17 to 1, while NASDAQ recorded a ratio of 2.02 to 1. These readings indicate broad participation in Wednesday’s advance.
2. NYSE internals showed particularly encouraging improvement.
New 52-week highs increased to 148, while new 52-week lows declined to 97. The fact that new highs exceeded new lows is an important positive development.
3. NASDAQ remains weaker than the NYSE.
Although NASDAQ recorded a substantial increase in new 52-week highs, new lows continued to outnumber new highs. This remains an important warning sign.
4. Higher trading volume supported Wednesday’s advance.
NYSE volume increased by approximately 34.6%, while NASDAQ volume rose by approximately 17%. This indicates stronger trading participation during the rally.
5. More positive sessions are needed.
One strong session cannot repair weeks of deteriorating market internals. Investors should look for sustained improvements rather than making decisions based on a single day’s statistics.
6. Capital preservation should remain a priority.
Traders and investors should continue to exercise caution, avoid excessive market exposure, and be prepared to reduce positions when market conditions deteriorate. Stop-loss discipline and appropriate position sizing remain particularly important in a volatile market.
4. Final Market Outlook
Wednesday’s U.S. market statistics were encouraging. Both the NYSE and NASDAQ recorded positive market breadth, higher trading volume, and improvements in their respective new-high/new-low relationships.
The NYSE demonstrated the more convincing improvement, with new 52-week highs exceeding new 52-week lows for the session. NASDAQ also improved, but its new 52-week lows continued to outnumber new highs, indicating that its internal weakness remains more pronounced.
The market appears to be making progress, but we should not confuse improvement with complete recovery.
The next several trading sessions will be particularly important. We want to see advancing issues continue to outnumber declining issues, new 52-week highs consistently exceed new 52-week lows, and trading volume provide continued support for rising prices.
Until these conditions become more firmly established, traders and investors should remain cautious and disciplined.
Our priority remains the protection of capital. We want to participate in the market when conditions improve, but we must avoid taking unnecessary risks while the market’s internal indicators remain weakened.
.
Wednesday’s U.S. Market Wrap-Up Report
Wall Street Rallies Strongly as Dow Jones Surges More Than 3%
Wednesday was a relatively strong and encouraging trading session on Wall Street. All four major U.S. market indexes finished higher, with the Dow Jones Industrial Average leading the advance with an impressive gain of 3.03%.
🔒 Premium Content
You must be a subscriber to access the remaining parts of this section. Current subscription rate is $60 CAD for a year
Login or Subscribe
Final Market Outlook
Wednesday was an impressive day for Wall Street. The Dow Jones surged more than 3%, all four major indexes finished higher, and several market sectors recorded substantial gains.
The performance of the NYSE was particularly encouraging, as market breadth improved significantly and new 52-week highs exceeded new 52-week lows. NASDAQ also showed improvement, although its market internals remain weaker.
The market is showing signs of renewed buying interest, but there is still work to be done before we can confidently conclude that a sustainable upward trend has been established.
The next several trading sessions will be important. We want to see the major indexes maintain their upward momentum, more stocks participate in the recovery, and market internals continue to strengthen.
For now, traders and investors should remain cautiously optimistic without becoming overly aggressive.
Our priority remains capital preservation. We want to be positioned to take advantage of improving market conditions, but we must also be prepared to protect our capital if the market’s recovery fails to develop into a sustainable upward trend.
.
NOTICE TO READERS
The Canadian Vanguard Stock Market is about empowering you to build and manage your wealth by yourself. There is certainly no magic in managing finances or wealth but one needs to know what to do and commit to doing what is needed. When you are ready to start the journey to Take Charge and Put Your Destiny In Your Own Hands, start with reading The Canadian Vanguard every market day. If and when you need more related information or to advertise your business products or services in The Canadian Vanguard, Contact Us
Our readers are strongly advised to conduct their own research into individual stocks before making a purchase decision. In addition, investors are advised that past stock performance is no guarantee of future price appreciation. Any recommendation is not a guarantee of any particular stock’s future prices, and The Canadian Vanguard accepts no responsibility or liability for investors’ or readers’ purchases.
The dollar sign “$” in the Toronto Market section in the articles only stands for Canadian dollar and in the US market section “$” stands for US dollar.
(c) This article is published by The Canadian Vanguard on November 4, 2026