
Wall Street Shrugs Off U.S.–Iran Tensions as AI and Miners Lead Rally
The Canadian Vanguard Stock Market Report Monday May 11, 2026 Edition
.
The Toronto Market
Monday’s Toronto Market Index
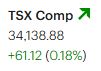
The Toronto S&P/TSX Composite Index rose 61.12 points, or 0.18%, to close at 34,138.88. The index has now posted gains for two consecutive sessions. However, Monday’s close remained well below Friday’s intraday levels, though it ultimately finished above Friday’s closing level. Trading volume on Monday was higher than on Friday.
Monday’s TSX Market Internals
At the Toronto S&P/TSX Composite Index, advancing issues outnumbered declining issues. Specifically, there were 1,197 advancers and 989 decliners, producing an advancer-to-decliner ratio of 1.21-to-1, or approximately six advancers for every five decliners. In addition, 117 issues were unchanged.
The exchange recorded 348 new 52-week highs and 59 new 52-week lows, compared with 328 new highs and 38 new lows on Friday.
Total trading volume on the TSX reached 507,067,474 shares, up 5% from the 482,908,065 shares traded on Friday. Trading volume was also slightly above the 50-day average daily trading volume.
Monday’s Toronto Market Wrap-Up Report
The Toronto S&P/TSX Composite Index finished Monday’s session modestly higher, gaining 61.12 points, or 0.18%, to close at 34,138.88. The advance marked the index’s second consecutive daily gain, supported by strength in commodity-related sectors and broad-based market participation. Trading activity also improved, with total TSX volume rising 5% to 507.1 million shares, slightly above the 50-day average daily volume.
Market breadth remained constructive for traders and investors. Advancing issues outpaced decliners by a 1.21-to-1 margin, with 1,197 stocks advancing versus 989 declining, while 117 issues finished unchanged. The TSX also recorded 348 new 52-week highs compared with just 59 new lows, signaling continued underlying momentum in select sectors despite mixed index performance.
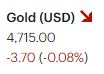
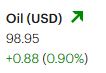
Sector performance was heavily concentrated in resource-related groups. Basic Materials led the market with a strong 2.99% gain, driven largely by continued strength in precious metals and mining shares. Energy advanced 1.42% as crude-related names remained firm, while Utilities edged higher by 0.11%. In contrast, weakness in heavyweight growth sectors limited broader index gains. Financials declined 0.41%, while the Technology sector dropped sharply by 6.07%.
In company-specific trading, Shopify Inc. (SHOP) fell 7.9% on volume of approximately 3.2 million shares. The sharp decline in Shopify weighed heavily on the TSX Technology sector due to the company’s significant index weighting. From a technical perspective, Shopify continues to trade below its 200-day moving average, a longer-term trend indicator closely monitored by institutional traders and technical analysts. Stocks trading below their 200-day moving averages are generally viewed as being in weaker long-term technical trends.
Leadership within Monday’s TSX session was dominated by precious metals and mining companies, reflecting ongoing investor interest in defensive commodity exposure and inflation-sensitive assets. The large number of new 52-week highs across the exchange further reinforced the strength currently developing within the resource segment of the Canadian market.
The US Markets
Monday’s U.S. Market Indexes
The major U.S. equity indexes finished modestly higher on Monday, with gains led by small-cap and blue-chip stocks. The Dow Jones Industrial Average rose 95.31 points, or 0.19%, to close at 49,704.47. The S&P 500 advanced 13.91 points, or 0.19%, ending the session at 7,412.84, while the Nasdaq Composite gained 27.05 points, or 0.10%, to finish at 26,274.13. The small-cap focused Russell 2000 Index outperformed, rising 9.43 points, or 0.33%, to close at 2,870.64.
The Dow Jones Industrial Average posted its second consecutive daily gain, continuing a modest near-term recovery in large-cap equities. While Monday’s advance was relatively small at 0.19%, the session reflected improving price action compared with the weaker performance seen over the previous several trading sessions. The ability of the Dow to extend gains for a second straight session may signal improving short-term investor sentiment toward blue-chip stocks.
The broader market remained relatively mixed beneath the surface, with investors continuing to rotate selectively between defensive sectors, technology shares, and small-cap opportunities. The Nasdaq Composite underperformed the other major indexes as technology-related momentum remained subdued, while the stronger performance in the Russell 2000 suggested renewed interest in higher-risk small-cap equities.

Monday’s U.S. Market Statistics
Market internals on Monday reflected a mixed trading environment beneath the modest gains in the major U.S. indexes. While the headline averages finished higher, breadth data on both the NYSE and NASDAQ showed underlying selling pressure in many individual stocks, even as new 52-week highs continued to expand.
On the New York Stock Exchange (NYSE), declining issues narrowly outnumbered advancing issues. There were 2,320 decliners versus 2,140 advancers, with 391 stocks unchanged, producing a decliner-to-advancer ratio of 1.08-to-1. Despite the slightly negative breadth, leadership remained constructive as the exchange recorded 567 new 52-week highs compared with only 144 new lows. This represented a notable improvement from Friday’s 429 new highs and 112 new lows, suggesting institutional money flow continues to favor selective leadership stocks.
NYSE trading activity also strengthened materially. Total volume reached approximately 5.99 billion shares, up 9% from Friday’s 5.49 billion shares. Rising volume accompanying higher index levels is generally viewed by traders as a sign of improving market participation and stronger conviction behind the advance.
At the NASDAQ, market breadth was weaker, reflecting continued pressure in growth and technology-oriented shares. Declining stocks outnumbered advancing stocks by roughly six decliners for every five advancers. Specifically, 2,755 stocks declined while 2,145 advanced, with 305 issues unchanged, resulting in a decliner-to-advancer ratio of 1.28-to-1.
Even with weaker breadth, NASDAQ leadership stocks continued to post fresh breakouts. The exchange recorded 451 new 52-week highs versus 197 new lows, improving from Friday’s 368 new highs and 150 new lows. The expanding list of new highs suggests that capital continues rotating into select momentum and institutional-quality growth names despite broader market volatility.
NASDAQ trading volume surged to approximately 12.43 billion shares, a strong 25% increase from Friday’s 9.90 billion shares. Elevated volume combined with mixed breadth often signals active sector rotation and heightened institutional trading activity, conditions that active traders closely monitor for potential breakout opportunities and short-term trend changes.
Monday’s U.S. Market Wrap-Up Report
U.S. equity markets delivered a mixed but constructive session for active traders and investors on Monday, with sector rotation, expanding new highs, and elevated trading volume highlighting continued institutional participation beneath the surface. While the major indexes posted modest gains, internal market data revealed selective leadership rather than broad-based buying.
Sector performance was led by cyclical and commodity-related groups. Energy was the strongest-performing sector, advancing 2.25%, followed by Basic Materials, which gained 1.87%. Utilities rose 1.14%, while Industrials added 1.03%, signaling continued investor rotation toward economically sensitive and infrastructure-related sectors. In contrast, Technology underperformed, slipping marginally by 0.08%, though the weakness was relatively contained considering the broader market volatility seen recently.
Monday’s session reflected several important crosscurrents that traders should continue monitoring closely. Market breadth remained negative at both the New York Stock Exchange and NASDAQ, with declining issues outnumbering advancing issues on both exchanges. However, despite the weaker breadth, the number of new 52-week highs continued to significantly exceed the number of new lows, a sign that institutional capital remains concentrated in leading momentum stocks and select growth themes.
Volume trends also pointed to heightened institutional activity. NASDAQ trading volume surged 25% above Friday’s levels to more than 12.4 billion shares, reflecting aggressive positioning in technology, artificial intelligence, and infrastructure-related names. NYSE volume also improved, rising 9% from the previous session to nearly 6.0 billion shares. Elevated volume alongside expanding new highs is typically viewed by technical traders as supportive of ongoing upside momentum in leadership groups.
One of the dominant themes on Monday was strength within the optoelectronics and data infrastructure segment, areas closely tied to artificial intelligence expansion and hyperscale data center spending. Lumentum Holdings Inc. (LITE) surged 16.5% on volume of approximately 9.6 million shares, while Applied Optoelectronics, Inc. (AAOI) jumped 24.1% with 16.6 million shares traded. Corning Incorporated also posted strong gains as investors continued accumulating companies leveraged to fiber-optic networking, AI infrastructure, and data center buildouts.
Semiconductor and memory-related stocks also attracted strong buying interest. Micron Technology, Inc. (MU) advanced 6.5% on heavy volume of approximately 71 million shares, reflecting ongoing bullish sentiment toward AI-driven memory demand. Meanwhile, SanDisk Corporation (SNDK) slipped 0.95% despite elevated trading activity of roughly 16.5 million shares. Even with Monday’s modest decline, the stock has experienced an exceptional rally over the past six weeks, underscoring the strong momentum currently present within storage and semiconductor-related industries.
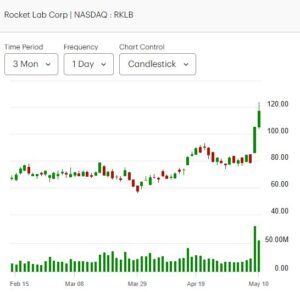
The space and aerospace segment also remained firmly on traders’ radar. Rocket Lab USA, Inc. (RKLB) continued to outperform following Friday’s explosive 34% gap higher after its earnings release. The stock generated its largest daily trading volume in the past year, a sign of substantial institutional interest and momentum-driven participation. Traders are increasingly viewing Rocket Lab as one of the stronger momentum names within the emerging commercial space industry.
Investors may also want to continue monitoring MDA Space Ltd. (MDA), which remains well-positioned within the growing space infrastructure and satellite technology sector. Continued investor interest in aerospace, defense technology, and space commercialization themes could provide ongoing trading opportunities within the group.
.
NOTICE TO READERS
The Canadian Vanguard Stock Market is about empowering you to build and manage your wealth by yourself. There is certainly no magic in managing finances or wealth but one needs to know what to do and commit to doing what is needed. When you are ready to start the journey to Take Charge and Put Your Destiny In Your Own Hands, read The Canadian Vanguard every market day. If you need more related information, Contact Us
Our readers are strongly advised to conduct their own research into individual stocks before making a purchase decision. In addition, investors are advised that past stock performance is no guarantee of future price appreciation. Any recommendation is not a guarantee of any particular stock’s future prices, and The Canadian Vanguard accepts no responsibility or liability for investors’ or readers’ purchases.
Stocks In The News/ Stocks To Watch and Market Strategy will soon be available but only to Paying Subscribers. The dollar sign “$” in the Toronto Market section in the articles only stands for Canadian dollar and in the US market section “$” stands for US dollar.
(c) This article is published by The Canadian Vanguard on May 11, 2026