

Markets Rise on Hopes Ceasefire Holds and Peace Persists
The Canadian Vanguard Stock Market Report Tuesday May 5, 2026 Edition
.
The Toronto Market
Today’s Toronto Market Index
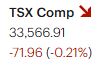
The S&P/TSX Composite Index slipped 71.96 points (-0.21%) to close at 33,566.91. The index opened lower, then rebounded to reach an intraday high of 33,790 before gradually declining. It remained in positive territory through midday, briefly dipping below the previous session’s close later in the day, and hovered near that level until the final half hour of trading.
Although the market finished in negative territory, underlying market internals were stronger than the headline decline suggests. Notably, only one of the ten sectors closed lower, indicating broader resilience beneath the surface.
The TSX has now declined for three consecutive sessions and has fallen in eight of the last eleven trading days. Despite this recent weakness, several bullish signals emerged during today’s session, suggesting potential underlying strength.
Today’s TSX Market Statistics
Market breadth on the TSX was notably positive, with advancing issues significantly outpacing declining ones. A total of 1,523 stocks advanced, compared to 586 decliners, resulting in an advancer-to-decliner ratio of 2.60:1—roughly five advancers for every two decliners. An additional 146 issues closed unchanged.
The exchange recorded 263 new 52-week highs and 52 new lows, an increase from yesterday’s 162 highs and 59 lows, highlighting strengthening upward momentum in select stocks.
Total trading volume reached 411,344,870 shares, representing a 17% decline from yesterday’s 497,335,283 shares. Despite today’s drop, yesterday’s volume was elevated and exceeded the 50-day average daily trading volume.
Today’s Toronto Market Wrap-Up Report (Technical View)
Geopolitical risk premiums eased as U.S. officials signaled a sustained ceasefire involving Iran. This drove a pullback in crude, with West Texas Intermediate crude oil declining 3.9% to $102.27 and Brent crude falling 3.1% to $110.83—pressuring sentiment in energy-linked names, though the sector showed relative resilience.
The S&P/TSX Composite Index slipped 0.2% on the session, but price action diverged from internal strength. Market breadth was notably positive, with advancers outpacing decliners by a 2.6:1 ratio—approaching levels typically associated with a short-term breadth thrust. While not a formal breadth thrust signal (which would require sustained momentum), today’s reading suggests improving participation after a weak multi-session stretch.
Volume declined 17% day-over-day and came in below the prior session’s elevated levels, indicating a lack of strong conviction behind the pullback. From a technical standpoint, this resembles a low-volume consolidation rather than aggressive distribution.
Sector rotation was evident. Consumer Discretionary (Durable Goods & Services) led with a 1.23% gain, followed by Telecommunications (+0.80%), Energy (+0.73%), and Financials (+0.61%). Technology lagged significantly, dropping 10.33%, creating a notable drag on the index and masking broader strength.
On the index level, near-term support is emerging in the 33,400–33,500 range, aligning with recent intraday lows and consolidation zones. A decisive break below this band could open the door to a test of the 50-day moving average. On the upside, resistance remains near the 33,750–33,800 area, close to today’s intraday high. A breakout above this level, particularly on expanding volume and sustained positive breadth, would strengthen the case for a short-term reversal.
In single-stock activity, Shopify Inc. dropped 15.62% following its Q2 earnings release. While headline results met expectations, forward guidance pointed to slowing growth, triggering heavy selling pressure. The stock traded approximately 5.2 million shares, well above its recent average—suggesting institutional repositioning and potential distribution. Given Shopify’s weighting, this decline heavily influenced the Technology sector’s weakness.
Celestica Inc. edged lower by 0.67%, showing relative stability compared to broader tech weakness.
Technical Takeaway:
Despite a negative close, the session exhibited characteristics of a potential accumulation phase—strong breadth, contained downside, and declining volume. Traders should watch for confirmation via follow-through buying, sustained breadth expansion, and a breakout above resistance. Conversely, failure to hold near-term support would signal that recent weakness remains intact.
.
The US Markets
Today’s U.S. Market Indexes
U.S. equities posted broad-based gains, with all major benchmarks closing higher and showing improving momentum following last week’s weakness.
The Dow Jones Industrial Average advanced 356.35 points (+0.73%) to close at 49,298.25, signaling a rebound in large-cap names after recent underperformance.
The S&P 500 rose 58.47 points (+0.81%) to 7,259.22, supported by strength across multiple sectors and improving market breadth.
The Nasdaq Composite gained 258.33 points (+1.03%) to finish at 25,326.13, reflecting renewed buying interest in growth and technology stocks.
The Russell 2000 led the session, jumping 49.01 points (+1.75%) to 2,845.00. The strong outperformance in small-cap stocks suggests a shift toward higher risk appetite and broader market participation.
Market Dynamics: Large-cap stocks reversed last week’s relative weakness, with the Dow posting a solid recovery. However, the standout move came from small caps, as the Russell 2000 significantly outpaced other indexes—often viewed as a bullish signal for near-term market sentiment and economic expectations.
Overall, today’s price action points to a risk-on tone, with leadership broadening beyond mega-cap stocks and into more cyclical and domestically sensitive segments of the market.

Today’s U.S. Market Statistics
New York Stock Exchange (NYSE): Market breadth was decisively positive, with advancing issues outpacing decliners by a wide margin. A total of 3,205 stocks advanced versus 1,269 declines, with 361 issues unchanged—resulting in an advancer-to-decliner ratio of 2.52:1, or roughly five advancers for every two decliners. This level of breadth reflects strong participation and supports the day’s upward price action.
The exchange recorded 563 new 52-week highs, a notable increase from 337 in the previous session, while new lows held steady at 90. The expansion in new highs without a corresponding rise in new lows signals improving momentum and underlying strength.
Total trading volume reached 5.42 billion shares, up 2% from the prior session. The modest increase in volume alongside strong breadth suggests steady institutional participation, though not at capitulation or surge levels typically associated with major breakouts.
NASDAQ: Breadth was also positive on the NASDAQ Composite, with 3,022 advancing stocks compared to 1,748 decliners and 338 unchanged issues. This produced an advancer-to-decliner ratio of 1.73:1, indicating solid—though less robust—participation relative to the NYSE.
The NASDAQ posted 434 new 52-week highs, up from 288 yesterday, while new lows edged higher to 119 from 107. The simultaneous increase in both highs and lows points to expanding dispersion, often seen during sector rotation or transitions in market leadership.
Total trading volume rose 4% to 8.33 billion shares, building on the prior session. The increase in volume, combined with rising new highs, supports the case for continued upside momentum, particularly within growth and technology segments.
Technical Takeaway:
Both exchanges exhibited constructive breadth and expanding new highs, reinforcing the broader market rally. The NYSE showed stronger participation, while the NASDAQ reflected a more selective advance with increased dispersion. Rising volume across both exchanges adds confirmation to the bullish tone, suggesting accumulation rather than short-covering.
U.S. Market Wrap-Up Report (Technical View)
Markets remained highly sensitive to geopolitical developments in the Middle East. Sentiment improved today after U.S. officials indicated that hostilities involving Iran have ceased and that a ceasefire remains in effect. The de-escalation reduced risk premiums across asset classes, particularly in energy, where crude prices retreated—helping ease inflation and volatility concerns.
Equities responded with a broad-based rally. The Russell 2000 led gains, advancing 1.7% and signaling a clear risk-on shift with strong participation in small-cap stocks. The NASDAQ Composite rose 1.03%, while the S&P 500 also moved higher. Both the Nasdaq and S&P 500 closed at fresh record highs, reinforcing the strength of the prevailing uptrend.
Market Internals & Trend Signals:
The rally was supported by constructive breadth and rising volume, pointing to institutional participation rather than short-covering. Leadership broadened beyond mega-cap names, with small caps and semiconductors driving momentum—often an early indicator of sustained upside.
From a technical standpoint:
- Major indexes remain well above their 50-day and 200-day moving averages, maintaining a strong bullish trend structure
- The breakout to new highs in the S&P 500 and Nasdaq confirms trend continuation, with no immediate signs of exhaustion
- Small-cap outperformance suggests improving confidence in domestic growth and liquidity conditions
Semiconductor Sector Leadership
In company-specific developments, Intel Corporation was a standout performer, surging 13% to close at $108.15 on exceptionally heavy volume of 198.48 million shares. The move represents a significant breakout, with the stock up sharply from its April 23 close of $66.78—indicating strong momentum and likely institutional accumulation.
Advanced Micro Devices gained 15% following robust Q1 earnings, driven primarily by accelerating demand in artificial intelligence data center segments. The results reinforce the ongoing strength of the AI-driven semiconductor cycle.
Arm Holdings also saw increased investor attention ahead of its earnings release scheduled for Wednesday, with expectations elevated following strong moves across the chip sector.
Technical Takeaway:
Today’s session reinforces a bullish continuation framework, supported by:
- Record highs in key indexes
- Strong breadth and volume confirmation
- Leadership from high-beta sectors (small caps, semiconductors)
Near-term, traders should watch for follow-through above breakout levels to confirm sustainability. Any pullbacks toward the 20-day or 50-day moving averages are likely to be viewed as buy-the-dip opportunities unless accompanied by deterioration in breadth or volume.
.
NOTICE TO READERS
The Canadian Vanguard Stock Market is about empowering you to build and manage your wealth by yourself. There is certainly no magic in managing finances or wealth but one needs to know what to do and commit to doing what is needed. When you are ready to start the journey to Take Charge and Put Your Destiny In Your Own Hands, read The Canadian Vanguard every market day. If you need more related information, Contact Us
Our readers are strongly advised to conduct their own research into individual stocks before making a purchase decision. In addition, investors are advised that past stock performance is no guarantee of future price appreciation. Any recommendation is not a guarantee of any particular stock’s future prices, and The Canadian Vanguard accepts no responsibility or liability for investors’ or readers’ purchases.
Stocks In The News/ Stocks To Watch and Market Strategy will soon be available but only to Paying Subscribers. The dollar sign “$” in the Toronto Market section in the articles only stands for Canadian dollar and in the US market section “$” stands for US dollar.
(c) This article is published by The Canadian Vanguard on May 5, 2026