







Markets’ Slide Continues as Oil Prices Rise and Bond Yields Surge to Multi-Year Highs
The Canadian Vanguard Stock Market Report Tuesday August 18, 2026 Edition
.
The Toronto Market
Tuesday Toronto Market Index
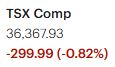
The S&P/TSX Composite Index slumped 299.99 points, or 0.82%, on Tuesday, closing at 36,367.93.
The market continued to show bearish momentum, with the TSX declining for a third consecutive trading session. More importantly, the losses have become progressively larger over the past three sessions. Friday’s decline was a modest 0.08%, followed by a 0.17% decline on Monday, before Tuesday’s much sharper 0.82% drop.
The index remained in negative territory throughout Tuesday’s session. It opened below the previous close, declined from the opening bell, and never moved back above Monday’s closing level at any point during the session. The persistent weakness from the opening bell through the close suggests that selling pressure remained firmly in control.
The three consecutive declines, combined with the accelerating pace of the losses, may indicate that the TSX is beginning to lose some of its recent upward momentum. However, the broader technical picture remains relatively strong. Despite the three straight negative sessions, the index continues to trade well above its 25-day, 50-day, and 200-day moving averages.
For now, the recent weakness appears to be a short-term deterioration rather than a confirmed reversal of the broader trend. Continued declines in the coming sessions could provide a clearer indication of whether the recent bearish pressure is developing into a more significant correction.
Tuesday’s TSX Market Statistics
At the TSX, declining issues (decliners) significantly outnumbered advancing issues (advancers) on Tuesday. There were 1,387 decliners compared with 774 advancers, producing a decliner-to-advancer ratio of 1.79 to 1. In other words, there were approximately nine decliners for every five advancers. Another 149 issues finished unchanged.
Market breadth remained firmly negative and weakened further on Tuesday, marking the second consecutive session of deterioration. The weakness was also evident in the 52-week statistics. The exchange recorded 55 new 52-week highs and 58 new 52-week lows, compared with 122 new 52-week highs and 50 new 52-week lows on Monday.
The number of new 52-week lows remained relatively stable, increasing slightly from 50 to 58. However, the number of new 52-week highs fell dramatically from 122 to just 55. As a result, new 52-week lows slightly outnumbered new 52-week highs on Tuesday, a notable deterioration from Monday’s much stronger reading.
The changing market internals suggest that the TSX may be gradually shifting toward a more bearish environment. The combination of three consecutive index declines, worsening market breadth, and the sharp reduction in new 52-week highs indicates that the underlying market strength is beginning to weaken.
Geopolitical developments in the Middle East continue to be an important factor influencing investor sentiment. Heightened geopolitical uncertainty can increase market volatility and, if conditions deteriorate further, could put additional pressure on equities.
Trading volume also declined on Tuesday. A total of 356,449,370 shares changed hands on the TSX, approximately 9% below Monday’s volume of 389,819,083 shares. The lower volume suggests that Tuesday’s decline was accompanied by somewhat less trading activity than the previous session.
Tuesday’s Toronto TSX Market Wrap-Up Report
Tuesday was another broadly negative session for the Toronto Stock Exchange, with the S&P/TSX Composite Index falling 299.99 points, or 0.82%, to close at 36,367.93. The decline marked the third consecutive losing session for the TSX, with the losses becoming progressively larger: 0.08% on Friday, 0.17% on Monday, and 0.82% on Tuesday.
The weakness was broad enough to keep the index in negative territory throughout the entire trading session. The TSX opened below Monday’s close, declined from the opening bell, and never regained the previous closing level. This persistent intraday weakness is an important development for traders because it suggests that sellers remained in control from the beginning to the end of the session.
Sector Performance
Five of the ten major TSX sectors managed to gain on Tuesday, an improvement in the number of advancing sectors compared with Monday. Energy was the strongest-performing major sector, rising 1.08%. Durable Consumer Goods & Services also posted a small gain of 0.05%.
The gains, however, were unable to offset weakness in several important sectors. Financials declined 1.01%, Healthcare fell 1.00%, Technology dropped 0.48%, and Utilities declined 0.23%. Consumer-related sectors also experienced weakness. Basic Materials, which was the strongest sector on Monday, became the laggard sector on Tuesday.
The sector rotation and the sharp decline in Financials are particularly noteworthy because Financials have a significant influence on the TSX. Weakness in this sector can place additional pressure on the overall index even when Energy and several other sectors are advancing.
Market Breadth Continues to Deteriorate
Tuesday’s market internals provided another warning signal for traders and investors. Declining issues dramatically outnumbered advancing issues, with 1,387 decliners versus 774 advancers. This produced a decliner-to-advancer ratio of 1.79 to 1, or approximately nine declining stocks for every five advancing stocks. Another 149 issues finished unchanged.
The deterioration was even more apparent in the 52-week statistics. The TSX recorded only 55 new 52-week highs against 58 new 52-week lows. On Monday, the exchange had recorded 122 new 52-week highs and only 50 new 52-week lows.
The number of new 52-week lows remained relatively stable, increasing from 50 to 58. The much bigger change was on the positive side: new 52-week highs collapsed from 122 on Monday to just 55 on Tuesday. This means that new 52-week lows slightly outnumbered new 52-week highs for the first time in this recent deterioration.
Taken together, the declining advance-decline ratio, the sharp reduction in new 52-week highs, and the increase in new 52-week lows suggest that the market internals are becoming increasingly bearish.
All Six Big Canadian Banks Decline
All six of Canada’s major banks declined on Tuesday, repeating Monday’s broad weakness in the banking group. However, Tuesday’s declines were considerably larger than Monday’s, making the financial-sector weakness more significant.
National Bank of Canada fell 2.43% to close at $226.07, with approximately 1.17 million shares traded. Toronto-Dominion Bank declined 1.68% to $169.62, with about 2.85 million shares changing hands. Royal Bank of Canada fell 1.28% to $296.26, with approximately 2.14 million shares traded.
The fact that all six major banks declined for a second consecutive session deserves attention. For traders, continued weakness across the major banks could become an important source of additional pressure on the TSX if the selling persists.
Enbridge Rebounds After Recent Weakness
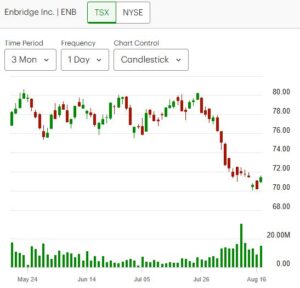
Enbridge (ENB) was one of the more notable individual stocks to rebound on Tuesday after several sessions of decline. The stock has been trending lower since mid-July and remains below its 25-day, 50-day, and 200-day moving averages.
Enbridge is generally viewed as an income-oriented, defensive investment because of its substantial dividend and relatively predictable cash-flow characteristics. That makes the recent weakness in the stock noteworthy, particularly because income-oriented and defensive stocks can sometimes attract investors when broader markets become unsettled.
However, the Tuesday rebound should not yet be interpreted as confirmation of a trend reversal. With the stock still below all three major moving averages, traders may want to see sustained buying pressure and a recovery above key moving-average levels before concluding that the recent downtrend has ended.
For income investors, the stock’s dividend yield remains an important consideration. At the current price, Enbridge offers a substantially higher indicated yield than typical GIC rates, but investors should remember that a stock dividend is not guaranteed in the same way as a GIC’s contracted return, and the share price can fluctuate significantly.
BRP Leads on the Upside
BRP Inc. (DOO) was one of the stronger individual performers on Tuesday, gaining 7.74% and closing at $95.31, with approximately 502,000 shares traded.
The sharp gain makes BRP a stock worth watching in the next few sessions. Traders will want to determine whether Tuesday’s move represents the beginning of a sustained recovery or simply a one-day rebound.
Trading Volume Declines: Total TSX trading volume reached approximately 356.45 million shares on Tuesday, about 9% lower than Monday’s 389.82 million shares.
The lower volume is worth noting because Tuesday’s market decline occurred despite less overall trading activity. If the TSX continues to decline while volume expands, that could provide stronger confirmation that institutional selling pressure is increasing.
.
Key Takeaways for Traders and Investors
1. The short-term trend is becoming increasingly bearish.
The TSX has now declined for three consecutive sessions, with each decline larger than the previous one. Tuesday’s 0.82% decline was significantly larger than the previous two sessions.
2. Market breadth is sending a warning signal.
With 1,387 decliners versus only 774 advancers, the selling was broad-based rather than concentrated in a small number of stocks.
3. The 52-week numbers have deteriorated sharply.
The collapse in new 52-week highs from 122 to 55 is particularly significant. New 52-week lows also slightly outnumbered new highs on Tuesday.
4. Financials deserve close attention.
All six major Canadian banks declined for the second consecutive session, with Tuesday’s losses larger than Monday’s. Continued weakness in the banks could put additional pressure on the TSX.
5. The broader uptrend has not yet been broken.
Despite three consecutive declines, the TSX remains well above its 25-day, 50-day, and 200-day moving averages. The recent weakness therefore appears to be a deterioration in short-term momentum rather than confirmation of a major long-term trend reversal.
6. Traders should watch the next few sessions closely.
The combination of weakening breadth, fewer new 52-week highs, three consecutive index declines, and broad weakness among the major banks suggests that caution is warranted. A stabilization in market breadth and a recovery in the major sectors would improve the short-term outlook. Conversely, further declines accompanied by expanding volume and continued deterioration in the 52-week statistics would strengthen the bearish case.
Bottom line: Tuesday’s session produced several warning signs beneath the surface of the TSX. Although the index remains comfortably above its major moving averages, the deterioration in market breadth and momentum suggests that the market’s recent strength is being tested. Traders should be particularly attentive to whether Wednesday and the following sessions confirm or reverse Tuesday’s bearish market internals.
.
The US Market
Tuesday’s US Market Indexes
All four major U.S. market indexes closed in negative territory on Tuesday, marking the second consecutive session in which all four indexes finished in the red. The selling was particularly pronounced in technology and small-cap stocks.
The Dow Jones Industrial Average declined 116.38 points, or 0.22%, closing at 53,343.40. The S&P 500 fell 53.30 points, or 0.69%, to finish at 7,691.76. The Nasdaq Composite was the biggest decliner among the major indexes, falling 355.20 points, or 1.33%, to close at 26,289.71. The Russell 2000 also came under significant pressure, declining 39.65 points, or 1.30%, to close at 3,017.89.

Nasdaq Weakness Is Becoming More Significant: The Nasdaq Composite significantly underperformed the broader market on Tuesday, extending its losing streak to three consecutive sessions. The index had appeared poised to challenge the 27,000 level, but the recent decline has pushed it farther away from that milestone.
The deterioration in the Nasdaq’s short-term momentum deserves attention. Three consecutive declines, combined with Tuesday’s relatively large 1.33% loss, could indicate that the index is transitioning from its recent bullish trend toward a more bearish short-term trend.
However, the Nasdaq remains well above its 25-day, 50-day, and 200-day moving averages. Therefore, while short-term momentum has weakened considerably, the longer-term technical trend has not yet been decisively broken.
Small-Cap Stocks Take a Significant Hit: The Russell 2000 declined 1.30% on Tuesday, ending a five-session winning streak. Small-cap stocks were hit harder than the Dow and S&P 500, reflecting the broader risk-off tone in the market.
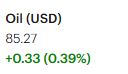
The weakness in small caps is particularly important because these stocks tend to be more sensitive to borrowing costs and changes in investor risk appetite. Rising bond yields and elevated oil prices added to the pressure on equities during Tuesday’s session.
Geopolitical Tensions Remain a Major Market Driver: Geopolitical tensions in the Middle East continue to play an important role in investor sentiment. Uncertainty surrounding the conflict has contributed to increased market volatility, while higher oil prices have added another layer of concern for investors.
Higher oil prices can put pressure on inflation expectations and potentially keep interest rates elevated for longer. Rising bond yields can also make equities less attractive relative to fixed-income investments, particularly when stock valuations are elevated.
The current bearish pressure could ease quickly if geopolitical tensions in the Middle East decline. However, investors should remain prepared for either outcome because further escalation could produce additional volatility across stocks, bonds, and commodities.
Broader Technical Picture Remains Intact
Despite the weakness over the past several sessions, the broader technical picture remains considerably stronger than the short-term price action suggests. The Nasdaq, S&P 500, and Russell 2000 all remain comfortably above their 25-day, 50-day, and 200-day moving averages.
This distinction is important for traders and investors. The recent declines indicate weakening short-term momentum, but they do not yet constitute clear evidence that the longer-term bullish trend has ended.
Key Takeaways for Traders and Investors
1. Short-term momentum has clearly weakened.
All four major U.S. indexes have declined for two consecutive sessions, while the Nasdaq has now fallen for three straight sessions.
2. Technology stocks are showing greater weakness.
The Nasdaq’s 1.33% decline was substantially larger than the Dow’s 0.22% loss, indicating that growth and technology stocks are facing greater selling pressure.
3. Small caps are also under pressure.
The Russell 2000’s 1.30% decline ended a five-session winning streak and suggests that investors are becoming more cautious toward higher-risk areas of the market.
4. Bond yields and oil prices remain important risks.
Higher yields can pressure equity valuations, while elevated oil prices can raise inflation concerns and potentially complicate the interest-rate outlook.
5. The major technical trend remains bullish—for now.
The Nasdaq, S&P 500, and Russell 2000 remain above their 25-day, 50-day, and 200-day moving averages. Traders should watch these levels closely for signs of either stabilization or a deeper correction.
6. Geopolitical developments could quickly change market direction.
A meaningful easing of tensions in the Middle East could help restore investor confidence and reverse some of the recent selling. Further escalation, however, could increase volatility and intensify the current risk-off environment.
Bottom line: Tuesday’s session provided additional evidence that U.S. equity markets are losing short-term momentum. The Nasdaq and Russell 2000 were hit particularly hard, while all four major indexes closed lower for a second consecutive session. Nevertheless, the indexes remain above their major moving averages, so the longer-term bullish structure remains intact. For now, traders should distinguish between a short-term correction and a confirmed trend reversal and watch the coming sessions for confirmation.
Tuesday’s US Market Statistics
New York Stock Exchange (NYSE): Market breadth on the New York Stock Exchange weakened considerably on Tuesday, with declining issues significantly outnumbering advancing issues. There were 2,938 decliners compared with 1,512 advancers, while 546 issues finished unchanged. This produced a decliner-to-advancer ratio of 1.94 to 1, meaning there were approximately two declining stocks for every advancing stock.
The breadth reading was clearly negative and represents another sign that selling pressure was broad-based rather than concentrated in a relatively small group of stocks.
The deterioration was also evident in the 52-week statistics. The NYSE recorded 169 new 52-week highs and 252 new 52-week lows, compared with 275 new highs and 226 new lows on Monday.
This represents a significant deterioration in the new-high/new-low balance. New 52-week highs fell approximately 39%, while new 52-week lows increased about 12%. As a result, new 52-week lows exceeded new 52-week highs by approximately 49%, producing a new-low-to-new-high ratio of roughly 3 to 2.
This is an important change in market internals. The combination of fewer new highs and more new lows suggests that the underlying market is losing strength and that the internal character of the market may be shifting toward bearish territory. However, it is still too early to confirm a major trend reversal based on one session. Several more trading sessions will be needed to determine whether this deterioration is temporary or the beginning of a sustained change.
Trading volume provided another development worth watching. Total NYSE volume reached approximately 4.59 billion shares, about 8% higher than the previous session’s 4.24 billion shares. Rising volume during a declining market is generally not the preferred combination for bulls because it can indicate increased participation in the selling.
For now, however, it is important not to draw too strong a conclusion from a single day’s increase in volume. Traders should watch whether elevated volume continues during additional declining sessions.
NASDAQ: Market breadth on the NASDAQ was also firmly negative for the third consecutive session. There were 3,080 declining issues compared with 1,797 advancing issues, while 463 issues finished unchanged. The resulting decliner-to-advancer ratio was 1.68 to 1, or approximately eight decliners for every five advancers.
The breadth reading weakened further, although the deterioration was somewhat less severe than on the NYSE. The number of unchanged issues increased approximately 17% from the previous session, suggesting that a greater number of stocks were unable to participate in the market’s upward or downward move.
The 52-week statistics provided an even stronger bearish signal. The NASDAQ recorded 118 new 52-week highs and 191 new 52-week lows, compared with 168 new highs and 168 new lows on Monday.
New 52-week highs declined approximately 30%, from 168 to 118, while new 52-week lows increased approximately 14%, from 168 to 191. As a result, new 52-week lows outnumbered new 52-week highs by a substantial margin.
This is particularly noteworthy because it is not common for new 52-week lows to exceed new 52-week highs when the broader market is still trading near elevated levels. The fact that this occurred on Tuesday, following a similar deterioration on Monday, suggests that the NASDAQ’s market internals are becoming increasingly bearish.
The NASDAQ has now experienced two consecutive sessions in which new lows have increased, while new highs have declined. Whether this becomes the beginning of a new trend will require confirmation from additional sessions, but the direction of the internal indicators is clearly something traders should monitor closely.
NASDAQ trading volume totaled approximately 7.57 billion shares, about 4% below Monday’s 7.88 billion shares. The lower volume is an important distinction from the NYSE. The NASDAQ declined sharply, but trading volume did not increase along with the decline.
This could mean that Tuesday’s weakness was more consistent with a market pullback rather than an aggressive expansion of selling pressure. However, if future declines occur with increasing volume, the bearish interpretation would become considerably stronger.
Market Internals Are Sending Warning Signals
Tuesday’s statistics provide several reasons for traders and investors to become more cautious.
Both the NYSE and NASDAQ recorded substantially more decliners than advancers. New 52-week highs declined on both exchanges, while new 52-week lows increased. On the NYSE, new lows exceeded new highs by roughly 3 to 2, while the NASDAQ also recorded considerably more new lows than new highs.
These developments are occurring at the same time that the major U.S. indexes have weakened. The Nasdaq Composite declined 1.33% on Tuesday and has now fallen for three consecutive sessions, while the S&P 500, Dow Jones Industrial Average, and Russell 2000 all declined for a second consecutive session.
The combination of weakening indexes and deteriorating market internals deserves attention.
.
Key Takeaways for Traders and Investors
1. Market breadth is clearly negative.
Decliners substantially outnumbered advancers on both the NYSE and NASDAQ. This indicates that Tuesday’s weakness was broad-based.
2. New-high/new-low statistics are becoming increasingly bearish.
Both exchanges recorded fewer new 52-week highs and more new 52-week lows. This is one of the clearest warning signs in Tuesday’s market statistics.
3. The NYSE showed heavier selling participation.
NYSE volume increased approximately 8% while the market declined. If this combination repeats, it could provide stronger evidence of expanding selling pressure.
4. NASDAQ volume does not yet confirm an aggressive sell-off.
Despite the Nasdaq Composite falling 1.33%, NASDAQ volume declined approximately 4%. This suggests that Tuesday’s decline should not yet be interpreted as definitive evidence of a major market breakdown.
5. The internal trend is deteriorating, but confirmation is still needed.
It is too early to declare that the broader U.S. market has entered a new bearish trend. However, the direction of the market internals has changed enough to warrant increased caution.
6. Investors should be prepared to shift gears if the weakness persists.
The major indexes remain above their 25-day, 50-day, and 200-day moving averages, so the longer-term trend has not yet been decisively broken. For now, the appropriate response is not necessarily to abandon the market, but to monitor risk more closely and be prepared to adjust positioning if the deterioration in breadth, new lows, and index momentum continues.
Bottom line: Tuesday’s market statistics added to the evidence that the internal strength of the U.S. equity market is weakening. The decline in new highs, increase in new lows, and negative advance-decline ratios on both major exchanges are meaningful warning signs. At the same time, NASDAQ volume declined despite the sharp drop in the index, and the major indexes remain above their key moving averages. The market is therefore at an important point: the current weakness may still prove to be a normal pullback, but if the bearish internals persist for several more sessions—and especially if declining prices are accompanied by rising volume—the probability of a more significant trend change will increase.
.
NOTICE TO READERS
The Canadian Vanguard Stock Market is about empowering you to build and manage your wealth by yourself. There is certainly no magic in managing finances or wealth but one needs to know what to do and commit to doing what is needed. When you are ready to start the journey to Take Charge and Put Your Destiny In Your Own Hands, start with reading The Canadian Vanguard every market day. If and when you need more related information or to advertise your business products or services in The Canadian Vanguard, Contact Us
Our readers are strongly advised to conduct their own research into individual stocks before making a purchase decision. In addition, investors are advised that past stock performance is no guarantee of future price appreciation. Any recommendation is not a guarantee of any particular stock’s future prices, and The Canadian Vanguard accepts no responsibility or liability for investors’ or readers’ purchases.
Stocks In The News/ Stocks To Watch and Market Strategy will soon be available only to Paying Subscribers. The dollar sign “$” in the Toronto Market section in the articles only stands for Canadian dollar and in the US market section “$” stands for US dollar.
(c) This article is published by The Canadian Vanguard on August 18, 2026



