
U.S. Market Indexes Rebound Despite Surging Treasury Yields
The Canadian Vanguard Stock Market Report weekend, September 25 – 27, 2026, Edition
.
The Toronto Market
Friday’s Toronto Market Index
The S&P/TSX Composite Index rose 94.43 points, or 0.26%, to close at 35,800.89.
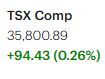

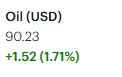
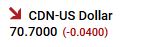
The TSX opened slightly below the previous close and initially moved lower. However, around midday, the market turned sharply higher and remained above the previous closing level for the rest of the session. Buyers stepped in during the final half hour, helping push the index higher into the close.
Closing with strength is generally a positive sign, as it indicates that buyers remained in control late in the session. The TSX finished slightly below the session high, but overall, Friday was a positive trading session for the Toronto market.
From a technical perspective, the TSX remains slightly below both its 25-day and 50-day moving averages. At the same time, the index continues to maintain a clear gap above its 200-day moving average.
Friday’s TSX Market Statistics
At the TSX, advancing issues (advancers) outnumbered declining issues (decliners). Specifically, there were 1,409 advancers and 761 decliners, producing an advancer-to-decliner ratio of 1.85 to 1, or approximately two advancers for every decliner. There were also 147 issues unchanged.
The exchange recorded 67 new 52-week highs and 183 new 52-week lows, compared with 37 new 52-week highs and 178 new 52-week lows on Thursday.
Market breadth was positive on Friday. The ratio of new 52-week highs to new 52-week lows improved slightly, moving to approximately 1:3, compared with 1:5 on Thursday. However, new 52-week lows continued to significantly outnumber new 52-week highs.
The number of new 52-week highs increased substantially from Thursday, while new 52-week lows increased by approximately 3%. Despite the improvement in the high-to-low ratio, the continued dominance of new 52-week lows indicates that the Toronto market’s internal indicators remain weakened.
Total volume on the TSX reached 375,997,081 shares, approximately 15% lower than the 440,452,829 shares traded on Thursday.
The TSX index rose on Friday, an improvement from Thursday’s decline. However, the increase in the index was accompanied by lower trading volume. This divergence suggests some underlying weakness in the market’s internal indicators.
Overall, Friday’s statistics were mixed. The positive market breadth and improvement in the new-high-to-new-low ratio were encouraging, but the continued prevalence of new 52-week lows and the decline in trading volume indicate that the market’s internal strength remains questionable.
We will need to monitor the TSX over the next several trading sessions to determine whether Friday’s advance represents the beginning of a change in the market trend or simply a short-term move higher.
.
Friday’s Toronto TSX Market Wrap-Up Report
The Toronto S&P/TSX Composite Index recovered on Friday from two consecutive sessions of declines, including a particularly sharp decline on Wednesday. The index rose 94.43 points, or 0.26%, to close at 35,800.89.
The session showed some signs of renewed buying interest. The TSX opened slightly below Thursday’s close and initially moved lower, but buyers stepped in around midday and pushed the index higher. The TSX then remained above the previous close for the remainder of the session. Buying intensified during the final half hour, allowing the index to finish near the upper end of the day’s range.
For traders, the late-session strength was an encouraging feature of Friday’s price action. However, the broader technical picture remains mixed. The TSX is still slightly below both its 25-day and 50-day moving averages, although it remains well above its 200-day moving average.
Sector Performance
Five major sectors finished higher on Friday, with consumer-related and financial stocks providing much of the leadership.
Discretionary Consumer Goods & Services was the strongest-performing sector, gaining 1.98%. Financials advanced 1.05%, while Durable Consumer Goods & Services rose 0.95%. Basic Materials also finished higher, gaining 0.43%.
The gains were offset by weakness in several other major sectors. Industrials slipped 0.11%, while Energy declined 1.01%. Telecommunications Services fell 1.11%.
Technology, which had been the top-performing sector on Thursday, reversed direction on Friday and declined 1.24%, making it the weakest-performing sector of the session.
The rotation between sectors from one session to the next is worth monitoring. Friday’s market advance was driven primarily by financial and consumer-related stocks rather than technology, which had provided leadership during the previous session.
Market Breadth and Internal Indicators
Market breadth was positive on Friday. There were 1,409 advancing issues compared with 761 declining issues, producing an advancer-to-decliner ratio of approximately 1.85 to 1. There were 147 issues unchanged.
The new-high/new-low statistics, however, remained less encouraging. The TSX recorded 67 new 52-week highs and 183 new 52-week lows, compared with 37 new highs and 178 new lows on Thursday.
The ratio of new 52-week highs to new 52-week lows improved to approximately 1:3 from 1:5 on Thursday. The improvement is constructive, but new 52-week lows still substantially outnumbered new 52-week highs. This indicates that, beneath the surface, the market continues to have areas of weakness.
Trading volume also declined. Total TSX volume was approximately 376 million shares, about 15% below Thursday’s 440.5 million shares.
The combination of a higher index, positive daily breadth and lower trading volume makes Friday’s advance somewhat mixed from an internal-market perspective. The price action improved, but the volume and new-high/new-low statistics do not yet provide strong confirmation of a broader improvement in market conditions.
Financial Stocks Lead
Canadian bank stocks were among Friday’s stronger performers. The major banks posted another session of gains, reversing some of the weakness seen earlier in the week.
Canadian Imperial Bank of Commerce (TSX: CM) led the major banks, gaining 2.07%. National Bank of Canada rose 1.35%, while Royal Bank (TSX: RY) gained 1.20%.
Bank of Montreal (TSX: BMO) advanced 0.78% to close at $243.97, with approximately 742,000 shares changing hands.
Bank of Nova Scotia (TSX: BNS) advanced 1.46% to close at $132.34, with approximately 2,100,000 shares traded.
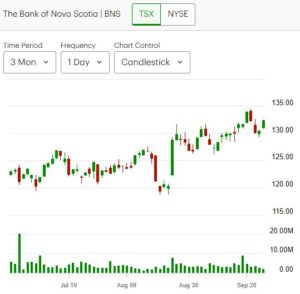
The financial sector carries significant weight within the TSX, so strength among the major banks can have a meaningful influence on the direction of the broader index. Continued strength in the banks would therefore be an important area to monitor in the coming sessions.
Company News: BlackBerry
BlackBerry was one of the notable individual-stock movers on Friday.
The company reported stronger earnings on Thursday, initially sending the stock higher. BlackBerry shares gained 3.63% on Thursday but reversed sharply on Friday, falling 5.70%.
The decline followed analyst actions that included downgrades and reductions in price targets by several investment firms.
The contrasting price action over the two sessions illustrates the importance of monitoring both company results and subsequent analyst reactions. For traders, BlackBerry’s reversal also demonstrates how quickly an earnings-related move can change direction when new information enters the market.
Weekly Sector Performance
On a weekly basis, Technology was the strongest-performing major sector, gaining 8.12%.
Industrials rose 3.77%, while Healthcare advanced 2.05%.
Financials finished the week slightly lower, declining 0.21%.
Energy fell 2.93%, while Telecommunications Services declined 5.02%, making them the weakest-performing sectors of the week.
The weekly numbers show a notable contrast with Friday’s session. Technology remained the strongest sector for the week despite being the weakest-performing sector on Friday, while Financials, which led Friday’s market, were slightly negative for the week.
Market Outlook and What to Watch
Friday’s session provided evidence of renewed buying interest following two consecutive declines. The positive advancer-to-decliner ratio, late-session buying and strength in the financial sector were constructive features of the session.
At the same time, several internal indicators remain weaker. New 52-week lows continued to outnumber new 52-week highs by a considerable margin, while total trading volume declined as the index moved higher.
The TSX also remains slightly below its 25-day and 50-day moving averages. Its position well above the 200-day moving average continues to indicate that the longer-term trend is materially stronger than the shorter-term picture.
The next several trading sessions will therefore be important. Traders will want to see whether Friday’s buying interest can continue and whether the TSX can regain and hold its shorter-term moving averages. Improvements in trading volume, new 52-week highs and the high-to-low ratio would provide additional evidence that market internals are strengthening.
Key Takeaways for Traders and Investors
- Friday’s price action improved: The TSX recovered from two consecutive declines and finished near the upper end of the session’s range, with buying strengthening late in the day.
- Market breadth was positive: Advancers outnumbered decliners by approximately 1.85 to 1.
- Market internals remain mixed: New 52-week lows continued to outnumber new highs by roughly 3 to 1.
- Volume requires monitoring: The index advanced while TSX trading volume fell approximately 15% from Thursday.
- Financials provided leadership: The major Canadian banks were among Friday’s stronger performers and helped support the broader index.
- Technology lost momentum for the session: Technology fell 1.24% Friday after leading the sectors on Thursday, although it remained the strongest-performing major sector for the week.
- The short-term technical picture remains unresolved: The TSX is still slightly below its 25-day and 50-day moving averages, while remaining comfortably above its 200-day moving average.
- Confirmation is still needed: The coming sessions will be important in determining whether Friday’s advance develops into a sustained improvement or remains a short-term rebound.
- Bottom line: Friday produced a better-looking trading session for the TSX, particularly in terms of price action, market breadth and financial-sector leadership. However, the weaker volume and continued dominance of new 52-week lows suggest that the improvement has not yet been confirmed by the market’s internal indicators. Traders and investors should watch the next several sessions for confirmation through price, volume, breadth and new-high/new-low statistics.
.
The US Markets
Friday’s U.S. Market Indexes
U.S. equity markets recovered on Friday from Thursday’s weak performance, with all four major indexes finishing higher. The Dow Jones Industrial Average was the strongest performer, while the Russell 2000 continued to lag the large-cap indexes.
The Dow Jones advanced 478.64 points, or 0.93%, to close at 51,828.62. The S&P 500 rose 39.28 points, or 0.51%, to finish at 7,743.41. The Nasdaq Composite gained 129.34 points, or 0.48%, closing at 27,068.72. The Russell 2000 edged higher by 1.98 points, or 0.07%, to close at 2,837.55.
The broad-based gains indicate that U.S. equities recovered some of Thursday’s weakness. However, the performance was uneven. The Dow posted a strong advance, while the Russell 2000 was essentially flat, highlighting continued relative weakness among small-cap stocks.
Small-Cap Stocks Remain a Concern
The Russell 2000’s modest 0.07% gain was significantly weaker than the performance of the Dow, S&P 500 and Nasdaq. Rising Treasury yields remain an important factor to watch because higher yields can increase borrowing costs and financing pressures for companies, which can be particularly relevant to smaller companies.
The continued weakness in small caps therefore contrasts with the stronger performance of large-cap stocks. Whether the Russell 2000 can regain momentum will be an important indicator of how broadly based any further advance in the U.S. equity market becomes.
Technical Picture
The major indexes remain in different technical positions.
The S&P 500 and Nasdaq Composite remain comfortably above their 25-day, 50-day and 200-day moving averages. Their continued position above all three moving averages indicates that their intermediate- and longer-term price trends remain relatively strong despite recent volatility.
The Dow Jones, by comparison, remains below both its 25-day and 50-day moving averages but continues to trade clearly above its 200-day moving average. This places the index in a mixed short- and intermediate-term technical position while maintaining a stronger longer-term position.
The Russell 2000 remains well below its 25-day and 50-day moving averages but clearly above its 200-day moving average. Its position reflects considerably more short- and intermediate-term weakness than that of the large-cap indexes.
Key Takeaways for Traders and Investors
- U.S. markets recovered Friday: All four major indexes finished higher following Thursday’s weakness.
- The Dow led the advance: It gained 0.93%, making it the strongest-performing major index on Friday.
- Large caps remain stronger than small caps: The S&P 500 and Nasdaq posted solid gains, while the Russell 2000 was nearly unchanged.
- Small caps remain an area to watch: The Russell 2000’s continued weakness contrasts with the stronger performance of the major large-cap indexes.
- Treasury yields remain important: Higher yields can create additional financing and valuation pressures, particularly for smaller companies.
- The technical picture remains divided: The S&P 500 and Nasdaq are above their 25-day, 50-day and 200-day moving averages, while the Dow and Russell 2000 remain below their shorter-term moving averages.
- The 200-day moving average remains an important longer-term reference: All four indexes are still above their respective 200-day moving averages.
- Bottom line: Friday’s session showed a broad recovery in U.S. equities, but the strength was not evenly distributed. Large-cap indexes continued to demonstrate greater relative strength, while the Russell 2000 remained comparatively weak. The relationship between Treasury yields, small-cap performance and the major indexes will be important to monitor in the coming sessions.
Friday’s U.S. Market Statistics
New York Stock Exchange (NYSE): Market breadth on the New York Stock Exchange was positive on Friday, with advancing issues outnumbering declining issues. There were 2,617 advancers, 1,936 decliners and 451 issues unchanged, producing an advancer-to-decliner ratio of approximately 1.35 to 1. In other words, there were roughly seven advancing stocks for every five declining stocks.
Despite the positive daily breadth, the new-high/new-low statistics remained considerably weaker. The NYSE recorded 85 new 52-week highs and 641 new 52-week lows, compared with 92 new highs and 818 new lows on Thursday.
The number of new 52-week highs declined modestly from Thursday, while new 52-week lows decreased by approximately 22%. Although the reduction in new lows is an improvement, the disparity between new highs and new lows remains substantial. New 52-week highs represented only about 13% of the number of new 52-week lows.
This imbalance continues to indicate weakness beneath the surface of the market. The major indexes advanced on Friday, but the large number of stocks making new 52-week lows suggests that the improvement in the indexes is not yet being broadly confirmed by the NYSE’s internal indicators.
NYSE trading volume reached approximately 4.63 billion shares, about 15% lower than Thursday’s 5.44 billion shares.
The combination of rising indexes, positive daily breadth and lower trading volume presents a mixed picture. The improvement in the number of new 52-week lows is encouraging, but the continued dominance of new lows and lower volume suggest that market internals remain weak.
NASDAQ: NASDAQ market breadth was also positive based on the figures provided. There were 2,617 advancing issues and 2,307 declining issues, with 220 issues unchanged. This produces an advancer-to-decliner ratio of approximately 1.13 to 1, meaning there were slightly more advancing stocks than declining stocks.
The NASDAQ recorded 85 new 52-week highs and 378 new 52-week lows, compared with 79 new highs and 486 new lows on Thursday.
The new-high/new-low data showed some improvement. New 52-week highs increased by approximately 8%, while new 52-week lows declined by approximately 22% compared with Thursday.
Despite this improvement, new 52-week lows continued to substantially outnumber new 52-week highs. There were more than four new 52-week lows for every new 52-week high. This continues to point to weakness in the NASDAQ’s internal market structure, even though the index itself advanced.
NASDAQ trading volume totaled approximately 7.58 billion shares, about 9% lower than Thursday’s 8.35 billion shares.
As with the NYSE, the NASDAQ index advanced while trading volume declined. The positive breadth and reduction in new 52-week lows are constructive developments, but the continued gap between new highs and new lows indicates that the improvement has not yet been fully confirmed by the market’s internal indicators.
What the Market Internals Are Telling Us
Friday’s market statistics present a mixed picture.
Both the NYSE and NASDAQ showed positive daily breadth based on the supplied advancing and declining issue counts. In addition, the number of new 52-week lows declined substantially on both exchanges compared with Thursday.
However, new 52-week lows continued to greatly outnumber new 52-week highs. This is an important sign that weakness remains widespread among individual stocks even as the major indexes recover.
Trading volume also declined on both exchanges as the major indexes moved higher. Lower volume does not necessarily invalidate an advance, but it provides less confirmation of the strength of the move than would be seen if higher volume accompanied the rising indexes.
For traders and investors, the key issue is whether Friday’s improvement in breadth and the reduction in new 52-week lows will continue over the next several sessions.
Key Takeaways for Traders and Investors
- Daily breadth improved: Both the NYSE and NASDAQ had more advancing stocks than declining stocks based on the supplied figures.
- New 52-week lows remain elevated: Despite declining from Thursday, new lows continued to substantially outnumber new highs on both exchanges.
- The NYSE remains particularly uneven: Only 85 stocks reached new 52-week highs compared with 641 new 52-week lows.
- NASDAQ internals also remain weakened: There were 85 new highs versus 378 new lows.
- New lows are moving in the right direction: The number of new lows declined significantly on both exchanges, which is a positive development worth monitoring.
- Volume declined: Trading volume fell on both the NYSE and NASDAQ while the major indexes advanced.
- The indexes and internal indicators are sending somewhat different messages: Index prices improved, but the new-high/new-low data continue to show considerable underlying weakness.
- More sessions are needed for confirmation: The next several trading sessions should provide a better indication of whether Friday’s improvement represents the beginning of a broader strengthening in market internals or simply a short-term recovery.
Bottom Line : Friday’s U.S. market statistics improved in several respects, particularly through positive daily breadth and a meaningful reduction in the number of new 52-week lows. However, the market’s internal structure remains uneven because new 52-week lows continue to significantly outnumber new highs.
The advance in the major indexes therefore deserves continued monitoring rather than immediate interpretation as a confirmed change in market trend. Additional sessions showing improving breadth, declining new lows, increasing new highs and stronger volume would provide greater confirmation that the market’s underlying condition is improving.
.
Friday’s U.S. Market Wrap-Up Report
U.S. equities recovered on Friday from Thursday’s weakness, with all four major indexes finishing higher. The Dow Jones Industrial Average led the advance, while the S&P 500 and Nasdaq Composite also posted solid gains. The Russell 2000, however, was essentially unchanged, highlighting the continued relative weakness in small-cap stocks.
The Dow Jones gained 478.64 points, or 0.93%, to close at 51,828.62. The S&P 500 advanced 39.28 points, or 0.51%, to 7,743.41. The Nasdaq Composite rose 129.34 points, or 0.48%, to 27,068.72. The Russell 2000 edged higher by just 0.07% to 2,837.55.
Treasury Yields Remain a Major Market Issue
One of the important issues facing the U.S. equity market remains the elevated level of Treasury yields.
The 10-year Treasury yield remained around 5.17% on Friday and finished the week at a relatively high level. Higher Treasury yields can affect equity valuations and borrowing costs and can be particularly challenging for smaller companies that are more sensitive to financing conditions.
Despite the elevated yield environment, stocks advanced Friday. The market’s ability to absorb higher yields without another broad equity decline was a notable feature of the session.
Interest-rate expectations also remain an important consideration for investors. The possibility of another Federal Reserve rate increase remains part of the market discussion, but economic data and financial conditions between now and the next policy decision could alter those expectations.
For traders, the relationship between Treasury yields and equity prices remains an important market signal. A continued rise in yields accompanied by weakening stock prices would present a different market picture from a situation in which yields remain elevated while equities continue to absorb the pressure.
Sector Performance
Eight of the major sectors advanced on Friday, with Financials leading the market with a gain of 0.89%.
Industrials rose approximately 0.64%, while Technology gained approximately 0.54%. Basic Materials advanced 0.41%, and Healthcare increased 0.38% after being the strongest sector in the previous session.
The weaker sectors were Telecommunications Services, down 0.21%, and Energy, which declined 0.99% and was the weakest-performing major sector of the session.
The sector rotation is worth monitoring. Financials and Industrials provided leadership Friday, while Energy lagged despite the broader market advance.
Weekly Sector Performance
Technology was the strongest major sector for the week, gaining 2.96%.
Energy rose 1.42%, while Healthcare advanced 1.26%.
Financials declined 1.28% for the week. Telecommunications Services fell 1.41%, while Utilities declined 2.12%, making Utilities the weakest-performing sector of the week.
The weekly results demonstrate that Friday’s sector leadership did not necessarily reflect the full week’s performance. Technology remained the strongest sector for the week despite Financials taking the lead during Friday’s session.
Market Internals Remain Mixed
The major indexes advanced Friday, but the underlying market statistics provide a more complicated picture.
On the NYSE, advancing issues outnumbered declining issues by approximately 1.35 to 1. NASDAQ breadth was also positive based on the supplied issue counts, with approximately 1.13 advancing stocks for every declining stock.
The number of new 52-week lows, however, continued to substantially exceed the number of new 52-week highs.
On the NYSE, there were 85 new 52-week highs compared with 641 new 52-week lows. On the NASDAQ, there were 85 new highs compared with 378 new lows.
There was some improvement from Thursday because the number of new 52-week lows declined on both exchanges. Nevertheless, the continued large disparity between new highs and new lows indicates that weakness remains widespread among individual stocks.
Trading volume also declined. NYSE volume was approximately 15% lower than Thursday, while NASDAQ volume declined by approximately 9%.
The combination of rising indexes, positive daily breadth and lower volume therefore produces a mixed market signal. The price action improved, but the internal indicators have not yet provided strong confirmation of a broad improvement in market conditions.
Individual Stocks to Watch
Meta Platforms (META) was among the notable individual stocks to watch. The stock declined approximately 3.3% on Friday. The decline came after a period of strength, so the pullback may be relevant for traders monitoring the stock’s price action and momentum.
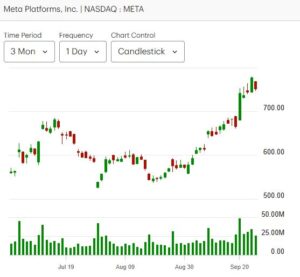
Meta’s Muse personal artificial-intelligence agent also remains an area of interest, particularly as investors assess user adoption and the broader commercial potential of AI-related products. The stock’s Friday decline should nevertheless be evaluated separately from the longer-term development of the company’s AI initiatives.
Several semiconductor-related stocks also attracted attention.
Tower Semiconductor gained approximately 6.07% on Friday, reversing much of the weakness seen during Thursday’s session.
Pure Storage (PSTG) also continued its recent strength, gaining approximately 3.38% Friday following an approximately 11% gain on Thursday. Trading volume reached about 6.3 million shares.
These stocks may be worth monitoring for continued momentum, but the sustainability of their recent moves will depend on subsequent price action and volume.
Technical Picture
The technical positions of the major indexes remain mixed.
The S&P 500 and Nasdaq Composite remain well above their 25-day, 50-day and 200-day moving averages, indicating that their intermediate- and longer-term trends remain comparatively strong.
The Dow Jones remains below its 25-day and 50-day moving averages but continues to trade clearly above its 200-day moving average.
The Russell 2000 remains well below its 25-day and 50-day moving averages but clearly above its 200-day moving average. The continued gap between the Russell 2000 and the large-cap indexes is an important indication of the uneven nature of the current market.
Key Takeaways for Traders and Investors
- The major indexes recovered Friday: All four major U.S. indexes finished higher, although the Russell 2000 barely advanced.
- The Dow led Friday’s market: It gained 0.93%, outperforming the S&P 500 and Nasdaq.
- Small caps remain relatively weak: The Russell 2000’s 0.07% gain was substantially below the performance of the large-cap indexes.
- Treasury yields remain important: The 10-year Treasury yield around 5.17% remains a significant consideration for equity investors.
- Technology led the week: Technology gained 2.96% for the week and remains an important source of market leadership.
- Financials led Friday: The sector gained 0.89% but remained down 1.28% for the week.
- Market breadth improved: Advancers outnumbered decliners on both the NYSE and NASDAQ based on the supplied statistics.
- Market internals remain uneven: New 52-week lows continued to substantially outnumber new highs on both exchanges.
- Volume did not confirm the advance: Trading volume declined on both the NYSE and NASDAQ as the indexes moved higher.
- The technical picture remains divided: The S&P 500 and Nasdaq remain above their key moving averages, while the Dow and Russell 2000 remain below their shorter-term averages.
- More confirmation is needed: Continued improvement in new highs versus new lows, stronger volume and sustained breadth would provide additional evidence that the market’s internal condition is improving.
Bottom Line
Friday’s session was constructive from the standpoint of index price action. The major indexes recovered from Thursday’s weakness despite elevated Treasury yields, and daily market breadth was positive on both the NYSE and NASDAQ.
However, the market’s internal indicators remain less convincing. New 52-week lows continue to substantially outnumber new highs, trading volume declined as the indexes advanced, and small-cap stocks remain considerably weaker than their large-cap counterparts.
For traders and investors, the key question in the coming sessions is whether Friday’s improvement can broaden beyond the major indexes. Continued strength in market breadth, a further reduction in new 52-week lows, stronger trading volume and improved performance from small caps would provide additional evidence that the market is strengthening beneath the surface.
.
NOTICE TO READERS
The Canadian Vanguard Stock Market is about empowering you to build and manage your wealth by yourself. There is certainly no magic in managing finances or wealth but one needs to know what to do and commit to doing what is needed. When you are ready to start the journey to Take Charge and Put Your Destiny In Your Own Hands, start with reading The Canadian Vanguard every market day. If and when you need more related information or to advertise your business products or services in The Canadian Vanguard, Contact Us
Our readers are strongly advised to conduct their own research into individual stocks before making a purchase decision. In addition, investors are advised that past stock performance is no guarantee of future price appreciation. Any recommendation is not a guarantee of any particular stock’s future prices, and The Canadian Vanguard accepts no responsibility or liability for investors’ or readers’ purchases.
Stocks In The News/ Stocks To Watch and Market Strategy will soon be available only to Paying Subscribers. The dollar sign “$” in the Toronto Market section in the articles only stands for Canadian dollar and in the US market section “$” stands for US dollar.
(c) This article is published by The Canadian Vanguard on September 27, 2026