
Market Benchmarks Face Growing Pressure as Rising Bond Yields and Oil Prices Persist
The Canadian Vanguard Stock Market Report Monday, September 28, 2026, Edition
.
The Toronto Market
Monday’s Toronto Market Index
The S&P/TSX Composite Index declined 311.03 points, or 0.87%, to close at 35,489.86.
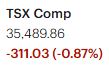

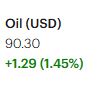
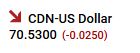
The TSX opened sharply lower, well below Friday’s close, and remained under pressure for most of the trading session. The index made an attempt to recover during the final half hour of trading, but renewed selling pressure pushed it lower once again. Despite the weakness, the TSX finished well above its session low, which was established within the first half hour of trading.
Market breadth was negative, reflecting broad-based weakness across the market. Geopolitical developments and ongoing tensions in the Middle East continue to be an important influence on market sentiment and daily trading activity.
Overall, it was a difficult session for the Toronto market. From a technical perspective, the TSX has now fallen below both its 25-day and 50-day moving averages. However, the index remains comfortably above its 200-day moving average, indicating that the longer-term trend remains notably stronger than the shorter-term trend.
Monday’s TSX Market Statistics
At the TSX, declining issues significantly outnumbered advancing issues. There were 1,760 decliners compared with 513 advancers, producing a decliner-to-advancer ratio of 3.43 to 1. In other words, there were approximately seven declining issues for every two advancing issues. A total of 124 issues were unchanged.
The exchange recorded 27 new 52-week highs and 213 new 52-week lows. This compares with 67 new 52-week highs and 183 new 52-week lows in the previous session. The market’s breadth was positive on Friday, but today’s figures point to a significant deterioration in the internal strength of the market.
The ratio of new 52-week highs to new 52-week lows was approximately 1 to 8 today, compared with roughly 1 to 3 in the previous session. New 52-week lows continue to substantially outnumber new 52-week highs, indicating continued weakness beneath the surface of the broader market.
The number of new 52-week highs declined significantly from the previous session, while the number of new 52-week lows increased. These figures suggest that the TSX’s internal indicators have weakened further.
Trading volume also increased considerably. A total of 466,950,726 shares changed hands on the TSX, 24% higher than the 375,997,081 shares traded on Friday. The combination of a sharp decline in the index and significantly higher trading volume warrants close attention. While higher volume does not necessarily indicate panic selling, the combination of declining prices and increased activity can be a sign of elevated selling pressure.
Overall, the TSX’s market internals weakened further today. The deterioration in market breadth, the large number of new 52-week lows, and the increase in trading volume suggest that a degree of caution is warranted. These internal indicators will be important to monitor in the sessions ahead.
Monday’s Toronto TSX Market Wrap-Up Report
The Toronto S&P/TSX Composite Index returned to the red on Monday, falling 311.03 points, or 0.87%, to close at 35,489.86. The index opened sharply lower and remained under pressure for most of the session. Although the TSX attempted to recover during the final half hour of trading, renewed selling pressure pushed the index lower again. The session low was established within the first half hour, and the index finished well above that low.
Despite the decline in the broader index, six of the ten major sectors finished higher. Technology led the advancing sectors, gaining 0.84%, followed by Consumer Discretionary, which rose 0.69%. Consumer Staples also finished modestly higher, gaining 0.16%.
Financials, however, reversed after two consecutive sessions of gains and declined 0.70%. The sector’s weakness was notable given the importance of financial stocks to the TSX. All six of Canada’s major banks finished lower on Monday. Continued uncertainty surrounding tariffs, trade policy and the broader economic outlook may be contributing to the pressure on bank stocks, although the market’s daily price action alone does not establish a specific cause.
Basic Materials was the session’s weakest major sector, falling 3.43%. The sector’s weakness was particularly significant for the TSX because resource-oriented companies represent a substantial portion of the Canadian market. Weakness in Basic Materials can therefore have an outsized impact on the direction of the broader index.
Market Internals Deteriorate
While the performance of the major sectors was mixed, the underlying market internals were considerably weaker.
Declining issues overwhelmed advancing issues, with 1,760 decliners compared with only 513 advancers. This produced a decliner-to-advancer ratio of approximately 3.43 to 1, meaning there were more than three declining issues for every advancing issue.
The new-high/new-low figures were also concerning. The TSX recorded only 27 new 52-week highs against 213 new 52-week lows. New 52-week lows therefore outnumbered new highs by almost eight to one.
Trading volume increased significantly as well. Approximately 466.95 million shares changed hands, up about 24% from the 375.997 million shares traded in the previous session.
The combination of a nearly 0.9% decline in the index, sharply negative market breadth, a large number of new 52-week lows and substantially higher trading volume points to a market with weakening internal strength. Higher volume does not, by itself, establish that panic selling is occurring, but the increase in activity alongside broad-based weakness is worth monitoring.
Stocks in Focus
BlackBerry
BlackBerry was one of Monday’s notable performers. After posting a strong earnings report on Thursday, the stock initially came under pressure following an analyst downgrade. BB rebounded sharply on Monday, gaining 8.12% despite the weakness in the broader market.
The stock’s ability to attract buying interest on a broadly negative market day makes it one to watch for continued momentum and confirmation in subsequent sessions.
Gildan Activewear
Gildan Activewear was another strong performer and ranked among the TSX’s top-performing stocks on Monday. The strength in the shares was notable given the overall weakness in the broader market.
For traders, the important question now is whether Monday’s strength develops into sustained momentum or simply represents a one-day move. Continued price strength and confirmation in the short term would provide more information about the stock’s underlying trend.
Shopify
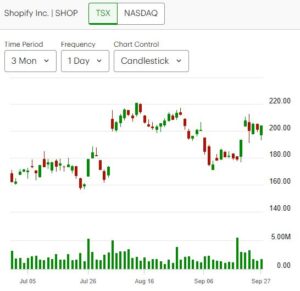
Shopify continues to attract attention as the stock appears to be entering a period of consolidation. The shares have been taking time to establish their next directional move rather than breaking decisively higher or lower.
From a technical perspective, Shopify remains above its 25-day, 50-day and 200-day moving averages. That positioning keeps the stock in a comparatively stronger technical position than many stocks trading below their key moving averages, although the current consolidation will need to resolve before a clearer short-term direction emerges.
TSX Technical Picture
The technical picture for the broader TSX has weakened. Following Monday’s decline, the index is now below both its 25-day and 50-day moving averages.
The longer-term picture is less concerning from a moving-average perspective because the TSX remains clearly above its 200-day moving average. This creates an important distinction between the short- and longer-term trends: short-term momentum has deteriorated, while the index remains above its major long-term trend indicator.
For traders, the next few sessions will be important in determining whether Monday’s weakness develops into a deeper correction or whether buyers step in and stabilize the index.
Key Takeaways for Traders and Investors
- Short-term momentum has weakened. The TSX is now below its 25-day and 50-day moving averages.
- Market breadth is a significant concern. Decliners outnumbered advancers by approximately 3.43 to 1.
- New lows are dominating new highs. There were 213 new 52-week lows compared with only 27 new highs.
- Volume increased substantially. Trading volume was approximately 24% higher than in the previous session while the index declined.
- Basic Materials remains important to watch. The sector’s 3.43% decline placed considerable pressure on the resource-heavy TSX.
- Financials weakened again. All six major Canadian banks finished lower, reversing some of their recent strength.
- Individual stocks are still showing relative strength. BlackBerry and Gildan Activewear were notable outperformers despite the market-wide weakness.
- Shopify remains technically stronger than the broader index. The stock is above its 25-day, 50-day and 200-day moving averages but appears to be consolidating.
- The 200-day moving average remains an important longer-term reference point. The TSX continues to trade above it despite the deterioration in its shorter-term technical indicators.
Overall, Monday’s session was a difficult one for the Toronto market. The headline decline in the TSX was accompanied by notably weaker market internals, particularly the breadth figures, the imbalance between new highs and new lows, and the increase in trading volume. These indicators suggest that traders should pay close attention to whether the weakness persists or whether the market begins to show signs of stabilization in the sessions ahead.
.
The US Markets
Monday’s U.S. Market Indexes
U.S. equities experienced broad-based weakness on Monday, with all four major indexes finishing lower.
The Dow Jones Industrial Average fell 347.11 points, or 0.67%, to close at 51,481.51. The S&P 500 declined 59.72 points, or 0.77%, finishing at 7,683.69. The Nasdaq Composite dropped 248.34 points, or 0.92%, to close at 26,820.38. The Russell 2000 slipped 19.64 points, or 0.69%, ending the session at 2,817.91.
Overall, it was a weak trading session across the U.S. equity market. The decline in all four major indexes reflected broad selling pressure, with smaller-cap stocks continuing to face a particularly challenging environment.
Rising Yields and Oil Prices Remain Headwinds
The combination of rising Treasury yields and higher oil prices is creating an increasingly difficult backdrop for equities. For small-cap stocks, the impact of higher yields can be particularly significant because smaller companies tend to be more sensitive to borrowing costs and financial conditions.
The Russell 2000 remains the most technically vulnerable of the four major indexes. The index is already well below its 25-day and 50-day moving averages and, although it remains above its 200-day moving average, the distance between the index and its 200-day moving average has narrowed substantially over the past week and a half.
A continued rise in Treasury yields could place additional pressure on small-cap stocks. Traders should therefore monitor the Russell 2000 closely for a potential test of its 200-day moving average. A decisive move below that long-term moving average would represent a notable deterioration in its technical picture.
Technical Picture
The Nasdaq Composite and S&P 500 both declined on Monday, but their longer-term technical positions remain comparatively strong. Both indexes continue to trade above their 25-day, 50-day and 200-day moving averages.
The Dow Jones presents a weaker short-term picture. It remains below both its 25-day and 50-day moving averages, although it continues to trade above its 200-day moving average. The gap between the Dow and its 200-day moving average has narrowed, making that long-term trend indicator increasingly important to watch.
The Russell 2000 remains the weakest of the four major indexes from a moving-average perspective. It is below its 25-day and 50-day moving averages and is now approaching its 200-day moving average from above. The narrowing gap between the Russell 2000 and its 200-day moving average suggests that this long-term technical level could become an important test for small-cap stocks in the near term.
Key Takeaways for Traders and Investors
- Broad weakness: All four major U.S. indexes declined on Monday.
- Large-cap technology remains technically stronger: The Nasdaq and S&P 500 remain above their 25-day, 50-day and 200-day moving averages.
- The Dow’s short-term trend remains weak: It is below its 25-day and 50-day moving averages but remains above its 200-day moving average.
- Small caps remain the most vulnerable: The Russell 2000 is below its 25-day and 50-day moving averages and is approaching its 200-day moving average.
- Treasury yields remain an important market variable: Continued increases in yields could place additional pressure on rate-sensitive areas of the equity market, particularly small caps.
- Oil prices are another potential headwind: Higher energy costs can add to inflationary pressures and complicate the interest-rate outlook.
- The Russell 2000’s 200-day moving average deserves close attention: A sustained break below this level would mark a further deterioration in the index’s technical structure.
- Overall, Monday’s session reflected a challenging environment for U.S. equities. The S&P 500 and Nasdaq remain technically above their major moving averages, but weakness in the Dow and particularly the Russell 2000 indicates that market strength is becoming less uniform. For traders, the behavior of Treasury yields and the Russell 2000’s response to its 200-day moving average will be important indicators to monitor in the sessions ahead.
Monday’s U.S. Market Statistics
New York Stock Exchange (NYSE): Market breadth on the New York Stock Exchange was decidedly negative on Monday, with declining issues significantly outnumbering advancing issues. There were 3,587 decliners compared with 1,010 advancers, while 455 issues were unchanged. This produced a decliner-to-advancer ratio of 3.55 to 1, meaning there were approximately seven declining stocks for every two advancing stocks.
The weakness was even more pronounced in the new-high/new-low figures. The NYSE recorded just 65 new 52-week highs against 847 new 52-week lows. This compares with 85 new highs and 641 new lows in the previous session.
The deterioration in these figures is notable. The number of new 52-week highs declined by approximately 24% from the previous session, while new 52-week lows increased by approximately 32%. New 52-week highs represented only about 8% of the number of new 52-week lows.
This substantial imbalance indicates that weakness was widespread beneath the surface of the major indexes. The market was not simply being pulled lower by a handful of large companies; a large number of individual stocks were experiencing significant deterioration.
Trading volume on the NYSE reached approximately 5.29 billion shares, 14% higher than the 4.63 billion shares traded in the previous session. Volume returned to approximately the level seen on Thursday and remained within the range of the 50-day average volume.
The combination of negative breadth, a sharp imbalance between new highs and new lows, and increased trading activity points to significantly weakened NYSE market internals. While these indicators do not by themselves establish that panic selling is occurring, they do suggest that traders should approach the current market environment with increased caution.
NASDAQ: Market breadth was also negative on the Nasdaq. There were 3,527 declining stocks compared with 1,350 advancing stocks, while 429 issues were unchanged. This produced a decliner-to-advancer ratio of 2.61 to 1, or approximately five decliners for every two advancers.
The Nasdaq’s new-high/new-low statistics also deteriorated significantly. The exchange recorded only 54 new 52-week highs compared with 529 new 52-week lows. In the previous session, there were 85 new highs and 378 new lows.
The number of new 52-week highs declined by approximately 36% from the previous session, while new 52-week lows increased by approximately 40%. New lows therefore outnumbered new highs by almost 10 to 1.
This is a particularly weak reading of market internals. The large number of new 52-week lows indicates that weakness is spreading across a broad range of Nasdaq-listed stocks, even though the major technology-oriented indexes remain above their longer-term moving averages.
Nasdaq trading volume totaled approximately 7.39 billion shares, down only 2.5% from the 7.58 billion shares traded in the previous session. Given the relatively small change in volume, this decline is not particularly significant and can reasonably be viewed as normal day-to-day variation rather than a meaningful change in trading participation.
Market Internals Remain Weak
The most important feature of Monday’s statistics is the deterioration in market breadth and the continued dominance of new 52-week lows over new 52-week highs.
Both the NYSE and Nasdaq recorded substantially more declining stocks than advancing stocks. More importantly, new 52-week lows dramatically outnumbered new 52-week highs on both exchanges.
The NYSE had 847 new lows versus just 65 new highs, while the Nasdaq recorded 529 new lows versus only 54 new highs. These figures indicate that the weakness is broad and extends well beyond the major market indexes.
This divergence between index levels and underlying market internals is worth watching closely. The S&P 500 and Nasdaq Composite remain above their 25-day, 50-day and 200-day moving averages, but the deterioration in individual-stock participation suggests that market strength has become less broad-based.
Key Takeaways for Traders and Investors
- Market breadth is significantly negative. Both the NYSE and Nasdaq had substantially more decliners than advancers.
- New 52-week lows are dominating new highs. The NYSE recorded 847 new lows versus 65 new highs, while the Nasdaq recorded 529 new lows versus 54 new highs.
- NYSE internals deteriorated further. New lows increased approximately 32% while new highs declined approximately 24%.
- Nasdaq internals also weakened sharply. New lows increased approximately 40% while new highs declined approximately 36%.
- NYSE volume increased 14%. The increase in volume accompanied a declining market and therefore deserves attention, although the volume remained around its recent average range.
- Nasdaq volume was essentially stable. The 2.5% decline from the previous session is relatively small and does not represent a significant change in participation by itself.
- The indexes and their underlying internals are sending different signals. The major indexes remain above important long-term moving averages, while a large number of individual stocks are experiencing substantial technical deterioration.
- Risk management becomes increasingly important in this environment. Traders should pay close attention to whether breadth and new-high/new-low statistics begin to stabilize or continue deteriorating.
Overall, Monday’s market statistics provide a clear warning about the underlying health of the U.S. equity market. The major indexes remain relatively resilient from a longer-term technical perspective, but the breadth and new-high/new-low data reveal considerably weaker participation underneath the surface.
For traders and investors, the key question in the coming sessions is whether this deterioration in market internals begins to reverse or whether the weakness continues to spread. A continued expansion in new 52-week lows, combined with persistently negative breadth, would indicate that the market’s internal structure remains under considerable pressure.
Monday’s U.S. Market Wrap-Up Report
U.S. equities endured a difficult trading session on Monday, with all four major indexes finishing lower. The Dow Jones Industrial Average fell 0.67%, the S&P 500 declined 0.77%, the Nasdaq Composite dropped 0.92%, and the Russell 2000 slipped 0.69%.
The market continues to contend with two significant macroeconomic headwinds: elevated and rising Treasury yields and higher oil prices. The 10-year Treasury yield increased another six basis points to 5.24% and reached a new high during Monday’s session. The continued rise in yields is an important consideration for equity investors because higher borrowing costs and tighter financial conditions can place pressure on equity valuations, particularly among more rate-sensitive companies.
The higher oil price environment adds another layer of uncertainty. Rising energy costs can contribute to inflationary pressure, potentially complicating the outlook for interest rates and monetary policy.
Broad-Based Weakness Across Sectors
Monday’s weakness was broad, with only three of the major sectors finishing higher.
Healthcare led the advancing sectors, although the gain was modest at just 0.35%. Energy followed with a 0.19% gain.
The weakness was much more pronounced among several economically sensitive and growth-oriented sectors. Technology declined 1.02%, Consumer Discretionary fell 1.18%, and Basic Materials was the session’s weakest major sector, dropping 1.52%.
The weakness in Technology was notable because the sector has been an important source of market strength. The decline also occurred despite continued strength in several individual technology-related stocks, demonstrating that sector performance remains uneven beneath the headline numbers.
Market Internals Show Significant Deterioration
The underlying market statistics were weaker than the major indexes alone might suggest.
On the NYSE, there were 3,587 declining issues compared with only 1,010 advancing issues, producing a decliner-to-advancer ratio of 3.55 to 1. The exchange recorded 847 new 52-week lows against just 65 new 52-week highs.
The Nasdaq showed a similarly weak internal picture. There were 3,527 decliners and 1,350 advancers, producing a 2.61-to-1 decliner-to-advancer ratio. The Nasdaq recorded 529 new 52-week lows compared with only 54 new 52-week highs.
The deterioration in the new-high/new-low statistics is particularly noteworthy. New 52-week lows dramatically outnumbered new highs on both exchanges, indicating that weakness was widespread among individual stocks.
NYSE trading volume increased approximately 14% to 5.29 billion shares. Nasdaq volume, at approximately 7.39 billion shares, was only 2.5% lower than in the previous session—a relatively small change.
The combination of negative breadth and a substantial imbalance between new highs and new lows suggests that the market’s internal structure remains weak. This is important for traders because the major indexes can remain relatively resilient even while an increasing number of individual stocks deteriorate.
Stocks in Focus
NVIDIA
NVIDIA was one of the notable bright spots within an otherwise weak technology sector. The company announced an additional $200 billion authorization for its share-repurchase program, and NVDA shares gained 1.68%, closing at $228.86.
Trading volume was particularly heavy, with approximately 142 million shares changing hands. The stock’s ability to advance while the broader technology sector declined makes NVDA an important stock to monitor for relative strength.
Cybersecurity Stocks
Cybersecurity stocks were among Monday’s stronger performers.
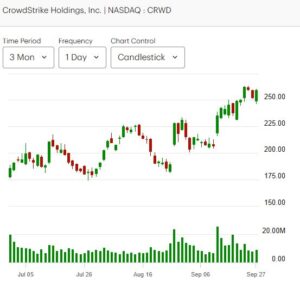
CrowdStrike gained 2.82% on approximately 9.0 million shares of volume. Palo Alto Networks rose 4.63% on approximately 6.0 million shares, while Fortinet advanced 1.65%.
The strength across several cybersecurity names stood out against the broader weakness in technology and suggests that there was selective buying within the sector rather than uniform weakness across all technology-related stocks.
Semiconductor Stocks
Semiconductor stocks generally underperformed on Monday. Micron Technology, SanDisk, Intel and Tower Semiconductor were among the weaker names.
The divergence between semiconductor stocks and cybersecurity stocks is worth watching. Both groups fall broadly within the technology ecosystem, yet their trading behavior was quite different during Monday’s session.
Data-Storage Stocks
Seagate Technology finished higher, while other disk-drive manufacturers declined. The mixed performance within the group again highlights the importance of individual-stock selection in the current market environment.
Technical Picture
From a technical perspective, the major indexes are not equally positioned.
The S&P 500 and Nasdaq Composite remain above their 25-day, 50-day and 200-day moving averages despite Monday’s decline. Their longer-term technical structures therefore remain stronger than the shorter-term market internals would suggest.
The Dow Jones remains below its 25-day and 50-day moving averages but is still above its 200-day moving average. The narrowing distance between the Dow and its 200-day moving average makes that longer-term trend indicator increasingly important.
The Russell 2000 remains the most technically vulnerable of the four major indexes. It is below its 25-day and 50-day moving averages and is approaching its 200-day moving average from above. The narrowing gap between the Russell 2000 and its 200-day moving average is something traders should monitor closely.
Key Takeaways for Traders and Investors
- All four major U.S. indexes declined. The weakness was broad rather than concentrated in one major index.
- Treasury yields remain a major market variable. The 10-year Treasury yield reached 5.24%, adding pressure to an already challenging equity-market environment.
- Higher oil prices add another potential headwind. The combination of higher energy prices and elevated yields creates a difficult macro backdrop for equities.
- Market breadth was decisively negative. Both the NYSE and Nasdaq recorded substantially more decliners than advancers.
- New 52-week lows dominated new highs. The NYSE recorded 847 new lows versus 65 new highs, while the Nasdaq recorded 529 new lows versus 54 new highs.
- The market’s internal weakness is broader than the index declines suggest. A large number of individual stocks are deteriorating even though the S&P 500 and Nasdaq remain above their major moving averages.
- Cybersecurity stocks showed relative strength. CrowdStrike, Palo Alto Networks and Fortinet all advanced despite the broader technology-sector decline.
- NVIDIA showed notable relative strength. NVDA gained 1.68% on heavy volume despite weakness across much of the technology sector.
- Semiconductors were under pressure. Several major semiconductor stocks declined significantly.
- The Russell 2000 remains particularly vulnerable. The index is approaching its 200-day moving average after already falling below its 25-day and 50-day moving averages.
- Selective strength remains available. Monday’s trading demonstrated that even in a weak market, certain groups and individual stocks can attract buying interest.
Bottom Line
Monday’s session reinforced the increasingly challenging character of the current U.S. equity-market environment. Rising Treasury yields and elevated oil prices continue to provide an unfavorable macroeconomic backdrop, while market internals have deteriorated substantially.
The most important warning sign is not simply that the major indexes declined. It is the breadth of the weakness underneath them: thousands of stocks declined, and new 52-week lows dramatically outnumbered new highs on both the NYSE and Nasdaq.
At the same time, the technical picture is not uniformly bearish. The S&P 500 and Nasdaq remain above their 25-day, 50-day and 200-day moving averages, while individual stocks such as NVIDIA and several cybersecurity names demonstrated relative strength.
For traders, the current environment therefore calls for close attention to market breadth, Treasury yields, the new-high/new-low balance, and relative strength among individual stocks. The behavior of the Russell 2000 around its 200-day moving average will also be an important technical indicator to monitor in the sessions ahead.
.
NOTICE TO READERS
The Canadian Vanguard Stock Market is about empowering you to build and manage your wealth by yourself. There is certainly no magic in managing finances or wealth but one needs to know what to do and commit to doing what is needed. When you are ready to start the journey to Take Charge and Put Your Destiny In Your Own Hands, start with reading The Canadian Vanguard every market day. If and when you need more related information or to advertise your business products or services in The Canadian Vanguard, Contact Us
Our readers are strongly advised to conduct their own research into individual stocks before making a purchase decision. In addition, investors are advised that past stock performance is no guarantee of future price appreciation. Any recommendation is not a guarantee of any particular stock’s future prices, and The Canadian Vanguard accepts no responsibility or liability for investors’ or readers’ purchases.
Stocks In The News/ Stocks To Watch and Market Strategy will soon be available only to Paying Subscribers. The dollar sign “$” in the Toronto Market section in the articles only stands for Canadian dollar and in the US market section “$” stands for US dollar.
(c) This article is published by The Canadian Vanguard on September 28, 2026