







Technology and Small-Caps Lead Market Rally as Big-Cap Stocks Take a Breather
The Canadian Vanguard Stock Market Report Tuesday, October 27, 2026, Edition
.
The Toronto Market
Tuesday’s Toronto Market Index
The S&P/TSX Composite Index advanced 227.33 points, or 0.63%, to close at 36,171.49 on Tuesday.



The TSX extended its winning streak to two consecutive sessions, with today’s performance showing an improvement over the previous session. The index reclaimed the psychologically important 36,000 level and finished comfortably above it, signaling renewed positive momentum.
The market appeared to shrug off ongoing geopolitical tensions in the Middle East. While diplomatic initiatives may be underway, recent reports suggest that no concrete breakthrough is imminent. Traders and investors should therefore remain alert to developments in the region and assess their potential impact on market sentiment and volatility before making trading decisions.
From a technical perspective, the TSX Composite is trading firmly above its 25-day and 50-day moving averages, while maintaining a healthy margin above its 200-day moving average. This positioning suggests that the broader upward trend remains intact, although investors should continue to monitor geopolitical developments and key technical levels for signs of a potential change in momentum.
Tuesday’s TSX Market Statistics
Market Breadth
Advancing issues significantly outnumbered declining issues on the Toronto Stock Exchange (TSX) on Tuesday, reflecting a positive market session and an improvement in market breadth. There were 1,546 advancing issues compared with 683 declining issues, resulting in an advancer-to-decliner ratio of 2.26:1. In other words, approximately 2.26 stocks advanced for every stock that declined. Another 139 issues remained unchanged.
These figures indicate that buying pressure was broadly distributed across the market, with advancing stocks substantially outnumbering declining stocks. Overall, market breadth strengthened during Tuesday’s session.
52-Week Highs and Lows
The exchange recorded 40 new 52-week highs and 46 new 52-week lows, compared with 75 new highs and 72 new lows in the previous session.
The number of new 52-week highs declined by approximately 47%, while new 52-week lows decreased by about 36% compared with Monday. Although the number of new lows remained slightly higher than new highs, the ratio of new highs to new lows improved to approximately 0.87:1, from 1.04:1 in the previous session.
The decline in both new highs and new lows suggests that the number of stocks reaching extreme annual price levels moderated. This may indicate some stabilization in market conditions, although the persistence of new 52-week lows slightly above new highs shows that underlying market weakness has not yet been fully resolved. A sustained period in which new highs consistently outnumber new lows would provide stronger evidence of improving market internals.
Trading Volume
Total trading volume on the TSX reached 397,432,992 shares, up approximately 2% from the 389,800,935 shares traded in the previous session. The modest increase in volume, alongside the index’s advance and positive market breadth, provides additional support for Tuesday’s constructive market performance.
Market Outlook
The TSX appears to be showing signs of stabilization, supported by two consecutive advancing sessions, stronger market breadth and a modest increase in trading volume. However, the market’s internal indicators remain mixed, and the number of new 52-week lows continues to exceed the number of new highs.
Investors should therefore remain cautious and closely monitor market breadth, trading volume and the relationship between new 52-week highs and lows. A sustained improvement in these indicators, particularly a consistent shift toward more new highs than new lows, would strengthen the case for a healthier and more durable market recovery.
Despite Tuesday’s encouraging performance, volatility is likely to remain a factor, making disciplined risk management and careful monitoring of market trends essential.
Tuesday’s Toronto Stock Exchange (TSX) Market Wrap-Up Report
TSX Market Overview: Buyers Regain Control
The Toronto Stock Exchange delivered a broadly positive session on Tuesday, with the S&P/TSX Composite Index advancing 227.33 points, or 0.63%, to close at 36,171.49. The index extended its winning streak to two consecutive sessions and reclaimed the psychologically important 36,000 level, closing comfortably above it.
The session was encouraging not only because of the index’s advance, but also because of the strength in market breadth. Advancing issues substantially outnumbered declining issues, suggesting that buying interest extended beyond a handful of large-cap stocks.
The TSX also continued to trade above its 25-day and 50-day moving averages while maintaining a comfortable margin above its 200-day moving average. This technical positioning supports the view that the broader upward trend remains intact, although further confirmation will be needed to establish whether the recent gains can develop into a more sustained advance.
Geopolitical tensions in the Middle East remained a potential source of uncertainty. Although the market appeared relatively resilient on Tuesday, traders should remain alert to developments that could trigger sudden changes in sentiment, commodity prices or overall market volatility.
Sector Performance: Leadership and Weakness
Basic Materials was identified in the draft as the session’s strongest sector, with a reported gain of 3.41%. Industrials also posted a solid advance of 1.17%. These performances suggest that selected resource and industrial stocks attracted buying interest.
However, the sector figures supplied in the original draft contain conflicting positive and negative readings for Financials, Utilities and Basic Materials. The complete sector ranking should therefore be verified before publication.
The draft also identified weakness in several growth-oriented and consumer-related groups, including Technology, Energy, Telecommunications Services and Consumer Goods and Services. Technology was reported down 1.26%, while Energy declined 1.63%, making it the weakest sector among the negative readings supplied.
For traders, the contrast between sector leaders and laggards is worth monitoring. Relative strength in resource-related shares may create opportunities in individual mining and materials stocks, while weakness in technology and energy could signal selective selling pressure. Sector-level conclusions should be confirmed against the final closing data.
Canadian Banks: Broad-Based Gains
All six of Canada’s major banks reportedly advanced during Tuesday’s session, providing additional support for the market’s positive performance.
National Bank of Canada (NA) gained 1.28%, while Bank of Montreal (BMO) rose 1.23%. Canadian Imperial Bank of Commerce (CM) advanced 1.07%, and Royal Bank of Canada (RY) gained 0.42%, according to the figures provided.
The broad participation among the major banks is constructive because financial stocks carry significant weight in the Canadian market. Continued strength in these shares could help support the TSX’s upward momentum.
Traders should nevertheless watch whether the banking sector can sustain its gains over subsequent sessions. One positive day does not, by itself, establish a durable sector trend.
Company News and Stocks to Watch
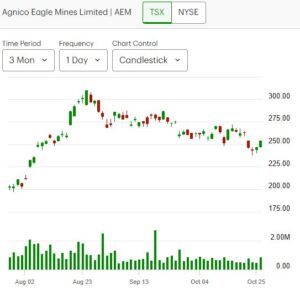
1. Agnico Eagle Mines (AEM): Gold-Mining Interest Remains Firm
Agnico Eagle Mines rose 2.95% on Tuesday to close at $253.75, with approximately 862,700 shares traded.
The company was mentioned in connection with new drilling results announced by White Gold Corp. (TSXV: WGO) from its fully funded 2026 diamond-drilling program at the White Gold Project in Yukon, Canada. Agnico Eagle is among the strategic partners supporting the project.
According to the supplied company announcement, the 2026 program represents White Gold’s largest drilling campaign to date on its flagship deposits. The Golden Saddle, Arc, VG and Ryan’s Surprise deposits remain open in multiple directions, and results from the program are expected to contribute to future mineral-resource updates. Assay results from another 44 diamond-drill holes were reported as pending.
Trading perspective: AEM’s 2.95% advance is worth monitoring alongside movements in gold prices, mining-sector sentiment and the stock’s trading volume. White Gold’s exploration results provide relevant background on the project, but they should not be interpreted as a direct indication of Agnico Eagle’s near-term earnings or valuation. Traders should distinguish between company-specific catalysts and broader strength in the precious-metals sector.
2. Bombardier Inc. (BBD.B): U.S. Investment and Technical Setup
Bombardier gained 3.28% on Tuesday, closing at $336.56 on approximately 226,310 shares traded.
The Montreal-based business-jet manufacturer has announced a US$270 million investment in the United States to expand its operations and manufacturing footprint. The investment has attracted favourable public comments from U.S. President Donald Trump following a period of heightened trade-related rhetoric involving the company.
According to the information supplied, the initiative is expected to create approximately 800 direct U.S. jobs. Bombardier also reported that its existing U.S. operations, service network and supply chain supported approximately 27,200 direct and indirect jobs in 2025. The company expects its total U.S. employment footprint to exceed 33,000 as its operations expand.
The investment may help reinforce Bombardier’s U.S. industrial presence and could be relevant to investors assessing its manufacturing capacity, customer relationships and exposure to cross-border trade policy. However, the longer-term financial impact will depend on execution, demand and the economics of the investment.
Technical perspective: The Bombardier chart appears to be developing the right-hand side of a potential cup pattern, while a possible double-bottom formation is also visible. Both are bullish chart patterns when confirmed, but neither should be treated as established solely on the basis of visual resemblance.
Traders should monitor whether the stock breaks above relevant resistance with convincing volume, as well as whether it holds important support levels during any pullback. A failed breakout could invalidate the bullish interpretation.
3. 5N Plus Inc. (VNP): Small-Cap Stock to Watch
5N Plus Inc. (TSX: VNP) advanced 4.81% on Tuesday to close at $28.30, with approximately 712,000 shares traded.
The company is scheduled, according to the supplied information, to release its third-quarter earnings on November 2. The upcoming report makes VNP a stock worth monitoring as investors look for updated financial results, management commentary and any changes to the company’s outlook.
For traders, the combination of a strong daily gain and the upcoming earnings catalyst may attract additional attention. However, a sharp advance ahead of an earnings announcement can also increase the risk of volatility in either direction.
Trading perspective: Monitor price action, volume, support and resistance ahead of the report. Investors considering a position should assess the company’s financial performance, valuation and outlook rather than relying solely on the recent price increase. The earnings date should also be verified against the company’s official investor-relations calendar before publication.
TSX Market Internals: Breadth Improves, but Caution Remains
Tuesday’s market statistics offered encouraging evidence of broader participation in the advance.
- Advancing issues: 1,546
- Declining issues: 683
- Unchanged issues: 139
- Advancer-to-decliner ratio: 2.26:1
With more than two advancing stocks for every declining stock, market breadth was clearly positive. This is a constructive sign because the index’s gain was accompanied by widespread participation across listed shares.
The exchange recorded 40 new 52-week highs and 46 new 52-week lows, compared with 75 new highs and 72 new lows in the previous session. New highs declined by approximately 47%, while new lows fell by about 36%.
Although the number of new lows remained slightly above new highs, both figures moderated. This may indicate that extreme price weakness and strength were becoming less prevalent. However, it does not yet establish a decisive improvement in the market’s longer-term internal condition.
Trading volume reached 397.43 million shares, approximately 2% above the previous session’s 389.80 million shares. The combination of a rising index, positive breadth and modestly higher volume adds credibility to Tuesday’s advance.
For a more convincing bullish signal, traders should look for the TSX to maintain its upward momentum while new 52-week highs begin to consistently outnumber new lows. A reversal in that relationship would provide stronger evidence that market internals are improving.
Technical Outlook: The 36,000 Level Is Back in Focus
The TSX Composite’s close at 36,171.49 puts the index back above the important 36,000 threshold.
The index’s position above its 25-day, 50-day and 200-day moving averages remains constructive. In particular, continued trading above the shorter-term averages would help confirm that recent upward momentum is holding, while the 200-day average remains an important reference point for the broader trend.
For the next several sessions, traders should monitor three developments:
- Follow-through above 36,000: The index should ideally maintain its position above this level rather than immediately falling back below it.
- Market breadth: Sustained advances in which advancing issues outnumber decliners would support the bullish case.
- New highs versus new lows: A consistent increase in new highs relative to new lows would provide stronger confirmation that participation is improving.
A failure to hold recent gains, particularly alongside deteriorating breadth, would warrant a more cautious interpretation of the rally.
Key Takeaways for Traders and Investors
1. The short-term outlook has improved. The TSX has advanced for two consecutive sessions and reclaimed 36,000. Its position above the 25-day and 50-day moving averages supports the current positive technical picture.
2. Tuesday’s breadth was a clear positive. The 2.26:1 advancer-to-decliner ratio indicates broad participation in the advance. Traders should watch whether this strength persists rather than relying on a single session.
3. Market internals still require confirmation. New 52-week lows continued to edge above new highs. A sustained reversal in this relationship would strengthen the case for a healthier market.
4. Follow sector leadership, but verify the data. The reported strength in selected materials and industrial stocks may offer opportunities, but the conflicting sector figures in the original draft should be resolved before drawing firm conclusions about leadership.
5. Watch individual catalysts carefully. Agnico Eagle, Bombardier and 5N Plus each have distinct drivers, ranging from mining-sector sentiment to capital investment and earnings. Company-specific developments should be assessed separately from the overall market trend.
6. Manage risk around geopolitical and earnings events. Unexpected headlines and company announcements can quickly change market conditions. Position sizing, stop-loss discipline where appropriate, and awareness of event risk remain important.
Final Assessment
Tuesday was an encouraging session for the Toronto market. The TSX regained the 36,000 level, advanced for a second consecutive day, and recorded positive market breadth alongside slightly higher trading volume. These factors suggest that short-term buying momentum has improved.
Nevertheless, the market’s internal indicators have not yet delivered a decisive confirmation of a sustained recovery. The next important signal will be whether the index can hold its recent gains while new 52-week highs begin to consistently outnumber new lows.
For traders, the current environment favours disciplined monitoring of price action, volume and relative strength rather than assuming that a durable rally is already established. For longer-term investors, the improving technical picture is encouraging, but confirmation from market internals and company fundamentals remains important.
.
The US Markets
Tuesday’s U.S. Market Indexes: Nasdaq Leads as Major Indexes Extend Gains
Market Overview: Broad Gains for a Second Consecutive Session
All four major U.S. stock market indexes advanced on Tuesday, extending their winning streak to two consecutive sessions. The Nasdaq Composite led the market, followed closely by the Russell 2000, as investors showed renewed buying interest in technology-oriented stocks and small-cap shares.
The Dow Jones Industrial Average edged higher, while the S&P 500 posted a solid gain. The Nasdaq Composite and Russell 2000 both advanced by more than 1%, making them the strongest performers of the session.
The gains were particularly encouraging for the Nasdaq, whose performance improved from the previous session. However, the positive daily price action must be considered alongside the indexes’ technical positions, which remain mixed.
Crude oil prices also advanced on Tuesday, a development that can create inflationary concerns and put pressure on equities. Nevertheless, U.S. stocks largely absorbed the increase and finished higher. Investors should continue monitoring energy prices, geopolitical developments and their potential implications for inflation, interest rates and corporate earnings.
Major Index Performance
| Index | Closing Level | Daily Change | Percentage Change |
|---|---|---|---|
| Dow Jones Industrial Average | 52,377.57 | +15.99 | +0.03% |
| S&P 500 | 7,722.60 | +45.83 | +0.60% |
| Nasdaq Composite | 26,477.81 | +308.43 | +1.18% |
| Russell 2000 | 2,818.87 | +32.45 | +1.16% |
Figures are based on the supplied market data.
Nasdaq Composite: Leading the Advance
The Nasdaq Composite gained 308.43 points, or 1.18%, to close at 26,477.81, making it Tuesday’s strongest-performing major index.
The advance suggests renewed buying interest in technology and other Nasdaq-listed stocks. The improvement in the index’s daily performance is encouraging, particularly given its recent technical weakness.
However, the Nasdaq remains below its 25-day and 50-day moving averages while trading comfortably above its 200-day moving average, according to the supplied technical assessment.
This positioning suggests that the recent rebound has not yet fully repaired the index’s short- to intermediate-term technical picture. For traders, a sustained recovery above the 50-day moving average would provide more convincing evidence that upward momentum is improving.
The reported increase in trading volume accompanying Tuesday’s advance adds interest to the move. Traders should nevertheless determine whether buying volume and price strength persist over subsequent sessions.
Russell 2000: Small-Cap Stocks Rebound
The Russell 2000 advanced 32.45 points, or 1.16%, to finish at 2,818.87. Its performance placed it second among the four major indexes.
The gain indicates renewed buying interest in small-cap stocks, which can be sensitive to financing costs, economic expectations and investor risk appetite.
Despite Tuesday’s advance, the Russell 2000 remains below its 25-day, 50-day and 200-day moving averages, according to the supplied technical data. This makes its recovery less convincing from a trend-following perspective.
A stronger recovery would require the index to regain important moving-average levels and demonstrate sustained follow-through. Until then, Tuesday’s gain is better viewed as a positive session within a technically weakened trend rather than confirmation of a lasting reversal.
S&P 500: Solid Gains, but Technical Challenges Remain
The S&P 500 rose 45.83 points, or 0.60%, to close at 7,722.60.
The advance was constructive and extended the index’s gains to a second consecutive session. However, the S&P 500 remains below its 25-day and 50-day moving averages while trading above its 200-day moving average.
This configuration indicates that the longer-term trend may remain supportive, but short- and intermediate-term momentum still needs improvement.
Investors should watch whether the index can regain its 50-day moving average and hold above it. Until that occurs, the recent gains should be viewed cautiously rather than as definitive evidence that the market has resumed a strong upward trend.
Dow Jones Industrial Average: Holding Up Better Technically
The Dow Jones Industrial Average added 15.99 points, or 0.03%, to close at 52,377.57.
Although the Dow recorded only a marginal gain, its technical position appears stronger than those of the other major indexes discussed here. The index remains above its 25-day, 50-day and 200-day moving averages, according to the supplied data.
That relative strength suggests the Dow’s broader trend remains more constructive. However, its limited advance on Tuesday indicates that buying interest was less pronounced than in the Nasdaq and Russell 2000.
Traders should monitor whether the Dow maintains its position above the shorter-term moving averages while the other indexes attempt to recover their own technical ground.
Technical Outlook: The 50-Day Moving Average Remains Important
Tuesday’s gains were encouraging, but the four major indexes are not in equally strong technical positions.
- Dow Jones: The strongest technical position among the four, remaining above its 25-day, 50-day and 200-day moving averages.
- Nasdaq Composite: Showing the strongest daily performance, but still below its 25-day and 50-day moving averages.
- S&P 500: Advancing, but still below its 25-day and 50-day moving averages.
- Russell 2000: Rebounding, but remaining below all three major moving averages.
For traders who use moving averages to assess trends, the 50-day moving average is an important reference point for intermediate-term momentum. A recovery above this level, followed by sustained trading above it, would strengthen the technical outlook for the Nasdaq and S&P 500.
The Russell 2000 faces a more substantial technical challenge because it remains below its 200-day moving average as well. Its recovery therefore requires closer monitoring before a more positive trend can be established.
At the same time, moving averages should not be treated as absolute rules. Their significance depends on the individual trading strategy, the stock or index being evaluated, price structure, volume and broader market conditions.
Key Takeaways for Traders and Investors
1. The market’s short-term momentum has improved. All four major indexes advanced for a second consecutive session, providing a constructive near-term signal.
2. Nasdaq and Russell 2000 led Tuesday’s gains. Both indexes rose by more than 1%. However, their strong daily performances do not yet eliminate their technical weaknesses.
3. The Dow remains technically stronger. Despite its modest gain, the Dow continues to trade above its three key moving averages, according to the supplied data.
4. Watch the 50-day moving average. A sustained recovery above this level would provide stronger evidence of improving intermediate-term momentum in the Nasdaq and S&P 500.
5. The Russell 2000 needs further recovery. Its position below the 25-day, 50-day and 200-day moving averages makes it particularly important to monitor for confirmation before assuming a durable reversal.
6. Rising crude oil prices remain a risk factor. Tuesday’s market resilience was encouraging, but further increases in oil prices could influence inflation expectations, interest-rate outlooks and investor sentiment.
Final Assessment
Tuesday was a positive session for U.S. equities, with all four major indexes extending their gains for a second consecutive day. The Nasdaq Composite led the advance, followed by the Russell 2000, while the S&P 500 recorded a solid gain and the Dow edged higher.
Nevertheless, the technical picture remains mixed. The Dow continues to show relative strength, while the Nasdaq and S&P 500 need to recover their 50-day moving averages to improve their intermediate-term outlook. The Russell 2000 faces the greatest technical challenge because it remains below all three key moving averages.
For traders, the priority is to determine whether Tuesday’s gains develop into a sustained recovery or remain a short-term rebound. For investors, the combination of positive daily momentum and unresolved technical weakness calls for a balanced approach: acknowledge the improving price action, but seek further confirmation before concluding that the broader market trend has decisively strengthened.
.
Tuesday’s U.S. Market Statistics: Breadth Improves, but Market Internals Remain Weak
1. New York Stock Exchange (NYSE)
Market Breadth: Buyers Outnumber Sellers
The New York Stock Exchange recorded positive market breadth on Tuesday, with advancing issues substantially outnumbering declining issues.
- Advancing issues: 2,914
- Declining issues: 1,593
- Unchanged issues: 471
- Advancer-to-decliner ratio: 1.83:1
Approximately 1.83 stocks advanced for every stock that declined, equivalent to roughly nine advancers for every five decliners. This indicates broad participation in Tuesday’s advance and provides an encouraging short-term signal.
However, positive daily breadth does not necessarily mean the market’s underlying condition has fully recovered. The new 52-week highs and lows continue to suggest that significant weakness remains beneath the surface.
New 52-Week Highs and Lows: Some Improvement, but Weakness Persists
The NYSE recorded 81 new 52-week highs and 146 new 52-week lows on Tuesday, compared with 114 new highs and 286 new lows in the previous session.
The number of new 52-week highs declined by approximately 29%, while new 52-week lows fell by about 49%. The more substantial decline in new lows is encouraging and suggests that fewer stocks were reaching fresh annual lows.
Nevertheless, new lows continued to outnumber new highs by approximately 1.80 to 1. The ratio of new highs to new lows was 0.55:1, meaning there were approximately 55 new highs for every 100 new lows.
Although this represents an improvement in the absolute number of stocks reaching new lows, the relationship between new highs and new lows remains unfavourable. The market’s internal indicators therefore continue to signal underlying weakness.
For traders and investors, the key development to watch is whether new 52-week lows continue to decline and, more importantly, whether new highs eventually begin to consistently outnumber new lows. A sustained reversal in this relationship would provide stronger evidence of a healthier market.
Trading Volume: Activity Moderates
Total NYSE trading volume reached approximately 5.26 billion shares on Tuesday, down about 11% from the previous session’s approximately 5.90 billion shares.
The combination of positive breadth and lower trading volume suggests that advancing stocks outnumbered declining stocks despite reduced overall trading activity. However, lower volume alone does not establish whether institutional buying is strengthening or weakening.
Traders should monitor whether subsequent advances are accompanied by improving breadth and stronger participation. A sustained recovery supported by constructive volume and improving new-high/new-low readings would provide a more convincing bullish signal.
NYSE Assessment
The NYSE showed some improvement in its market internals on Tuesday, particularly through the substantial reduction in new 52-week lows. Positive market breadth was another encouraging development.
However, the number of new lows remained significantly higher than the number of new highs. The market’s internal condition should therefore still be considered weak, despite the improvement in selected indicators.
A more durable recovery will likely require a sustained sequence of constructive sessions, accompanied by fewer new lows, expanding market breadth and eventually a consistent excess of new 52-week highs over new lows.
Until these conditions emerge, traders and investors should remain selective, manage position sizes carefully and establish clear exit criteria for positions that move against them.
2. NASDAQ
Market Breadth: Advancers Outnumber Decliners
NASDAQ also recorded positive daily breadth on Tuesday, with advancing stocks significantly outnumbering declining stocks.
- Advancing issues: 3,236
- Declining issues: 1,702
- Unchanged issues: 387
- Advancer-to-decliner ratio: 1.90:1
There were approximately 1.90 advancing stocks for every declining stock, indicating broad participation in the session’s gains.
This is a constructive short-term development, particularly given the Nasdaq Composite’s reported advance. However, the positive advancer-to-decliner ratio contrasts with the weakness still evident in the exchange’s new 52-week highs and lows.
Important distinction: Daily market breadth was positive based on the figures supplied. The broader market internals remain weak because new 52-week lows continue to substantially outnumber new highs. These two observations are not contradictory; they measure different aspects of market participation.
New 52-Week Highs and Lows: Underlying Weakness Remains Significant
NASDAQ recorded 85 new 52-week highs and 289 new 52-week lows on Tuesday, compared with 116 new highs and 436 new lows in the previous session.
The number of new highs declined by approximately 27%, while new lows fell by approximately 34%. Although the reduction in new lows is encouraging, the number of stocks reaching fresh annual lows remains substantially higher than the number reaching new highs.
The ratio of new highs to new lows was approximately 0.29:1, equivalent to roughly one new high for every 3.4 new lows.
This imbalance highlights the continuing weakness in NASDAQ’s market internals. Despite Tuesday’s positive breadth, a considerable number of stocks remain under pressure relative to their 52-week trading ranges.
The recent pattern of new lows consistently exceeding new highs suggests that the market has yet to establish a convincing improvement in underlying participation. A sustained recovery will require more than a few positive index sessions; it will require a meaningful and persistent improvement in these internal indicators.
Traders should therefore monitor the new-high/new-low relationship closely. A gradual reduction in the excess of new lows would be encouraging, while a sustained period in which new highs outnumber new lows would provide a much stronger bullish signal.
Trading Volume: Confirm the Recovery Before Drawing Conclusions
NASDAQ trading volume was reported at approximately 8.19 billion shares on Tuesday, compared with approximately 7.66 billion shares in the previous session. Based on these figures, volume increased by approximately 7%.
The combination of an advancing index, positive daily breadth and higher reported volume is constructive. It suggests that Tuesday’s advance occurred alongside increased trading activity.
However, higher volume on a single advancing session does not establish that a durable recovery is underway. Traders should look for repeated sessions of positive price action, sustained participation and improving market internals.
If NASDAQ can produce a sequence of advancing sessions with supportive volume while new 52-week lows continue to decline, confidence in the recovery would gradually improve. Conversely, a reversal in price action accompanied by deteriorating breadth or a renewed expansion in new lows would warrant caution.
NASDAQ Assessment
NASDAQ’s Tuesday performance was encouraging from a short-term trading perspective. Advancing stocks substantially outnumbered declining stocks, and the index’s gain was reportedly accompanied by higher trading volume.
Nevertheless, the exchange’s new-high/new-low figures continue to reveal significant underlying weakness. With 289 new lows against only 85 new highs, the market has not yet demonstrated the broad internal improvement needed to support confidence in a sustained recovery.
The immediate task is to watch whether the index can maintain its positive momentum and whether its market internals begin to strengthen over subsequent sessions. A sustained improvement would be much more meaningful than an isolated rebound.
3. Key Takeaways for Traders and Investors
1. Daily breadth was positive on both exchanges. Advancers outnumbered decliners on the NYSE and NASDAQ, suggesting that Tuesday’s gains involved broad participation.
2. New 52-week lows declined on both exchanges. This was an encouraging development, particularly on the NYSE, where new lows fell by approximately 49%. However, new lows continued to outnumber new highs on both exchanges.
3. NASDAQ’s underlying condition remains vulnerable. The exchange recorded 289 new lows against only 85 new highs. This substantial imbalance cautions against interpreting one strong index session as confirmation of a durable recovery.
4. Volume provides a mixed but useful signal. NYSE volume declined by approximately 11%, while NASDAQ volume increased by approximately 7%, based on the supplied figures. Further sessions are needed to determine whether buying interest can persist.
5. Look for confirmation, not just a rising index. A stronger recovery would combine positive index performance, favourable advancing/declining ratios, improving volume patterns and a sustained reduction in new 52-week lows.
6. Maintain disciplined risk management. Until market internals improve consistently, traders should avoid assuming that recent gains guarantee further advances. Position sizing, entry discipline and predetermined exit criteria remain important in an uncertain market.
Final Assessment
Tuesday’s U.S. market statistics presented a mixed picture. Both the NYSE and NASDAQ recorded positive daily breadth, and the number of new 52-week lows declined on both exchanges. NASDAQ also showed higher reported trading volume, which adds to the constructive short-term picture.
However, the underlying market internals remain weak. New 52-week lows continued to exceed new highs on both exchanges, particularly on NASDAQ, where the imbalance remains substantial.
For traders, Tuesday’s performance offers reasons for cautious optimism, but not yet sufficient evidence to declare a sustained market recovery. For investors, the priority should be to monitor whether the improvement continues across multiple sessions.
The most convincing signal would be a sustained sequence of advancing sessions accompanied by healthy market breadth, supportive trading activity and, ultimately, a consistent shift toward more new 52-week highs than new lows. Until then, a cautious and disciplined approach remains warranted.
Tuesday’s U.S. Market Wrap-Up Report
Major Indexes Advance, Technology Rebounds, but Market Internals Remain Weak
Market Overview: Another Positive Session for Wall Street
U.S. stocks extended their winning streak to two consecutive sessions on Tuesday, with all four major indexes finishing higher. The Nasdaq Composite led the advance, followed by the Russell 2000, as buying interest returned to technology stocks, semiconductor shares and other growth-oriented areas of the market.
The Dow Jones Industrial Average edged higher, while the S&P 500 posted a solid gain. Eight of the eleven major sectors reportedly advanced, suggesting that Tuesday’s gains extended across a broad portion of the market.
However, the market’s positive price action should be considered alongside its still-weakened internal indicators. Although advancing stocks substantially outnumbered declining stocks on both the NYSE and NASDAQ, new 52-week lows continued to exceed new highs on both exchanges. This divergence suggests that many individual stocks remain under pressure despite the major indexes’ recent gains.
For traders, Tuesday’s session was encouraging, particularly in technology and semiconductor stocks. Nevertheless, further confirmation is needed before concluding that the broader market has established a sustainable recovery.
Major Index Performance
| Index | Closing Level | Daily Change | Percentage Change |
|---|---|---|---|
| Dow Jones Industrial Average | 52,377.57 | +15.99 | +0.03% |
| S&P 500 | 7,722.60 | +45.83 | +0.60% |
| Nasdaq Composite | 26,477.81 | +308.43 | +1.18% |
| Russell 2000 | 2,818.87 | +32.45 | +1.16% |
The Nasdaq Composite was Tuesday’s strongest-performing major index, gaining 1.18%, while the Russell 2000 advanced 1.16%. The S&P 500 rose 0.60%, and the Dow recorded a marginal gain of 0.03%.
The Nasdaq’s stronger performance is particularly noteworthy because the index has been struggling to regain its shorter-term technical footing. Tuesday’s advance is constructive, but the index remains below its 25-day and 50-day moving averages, according to the supplied technical assessment.
The S&P 500 also remains below those two moving averages. The Russell 2000 faces a greater challenge, trading below its 25-day, 50-day and 200-day moving averages. In contrast, the Dow remains above all three, giving it the strongest technical position among the four indexes.
Sector Performance: Technology and Basic Materials Lead
Eight of the eleven major sectors advanced on Tuesday, according to the supplied sector data. Basic Materials led with a gain of 2.06%, followed by Technology, which rose 1.28%.
Utilities gained 1.21%, while Telecommunications Services advanced 0.63%. Financials posted a modest gain of 0.08%.
Energy was the weakest reported sector, declining 1.85%.
The strength in Technology and Basic Materials helped support the broader market advance. Technology’s performance was particularly important given the recent weakness in semiconductor stocks and AI-related hardware companies.
However, the sector picture was not uniformly bullish. Energy’s decline highlights the uneven nature of the session, while the modest gain in Financials suggests that participation varied considerably across industries.
For traders, sector leadership is worth monitoring over the next several sessions. Sustained strength in technology and semiconductor shares could help support the Nasdaq and S&P 500, while continued weakness in other groups could limit the breadth and durability of a recovery.
Oil Prices and Treasury Yields: Conflicting Signals Require Verification
The original market notes contain conflicting crude oil figures. One entry reports that U.S. crude fell 1.8% to $99.90 per barrel, while another says crude oil futures rose more than 1% to above $101.
These observations may refer to different reporting times or contracts, but the discrepancy needs to be resolved before publication.
The 10-year U.S. Treasury yield was reported to be essentially unchanged at 4.99%. A stable Treasury yield can reduce an additional source of pressure on equities during a trading session, although its significance depends on the broader interest-rate outlook and investor expectations.
Traders should continue monitoring crude oil prices and Treasury yields. Sharp moves in either can influence inflation expectations, bond yields, corporate costs and valuations, particularly for growth-oriented stocks.
Company and Industry Developments
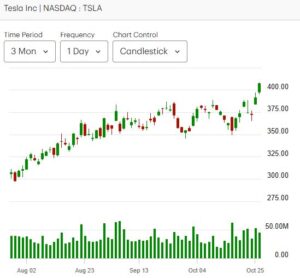
Tesla: Shares Reclaim the $400 Level
Tesla (TSLA) gained 4.04% on Tuesday, moving above the $400 mark according to the supplied market notes.
The advance made Tesla one of the notable individual-stock performers of the session. Traders should monitor whether the stock can sustain its move above $400 and build on the gain over subsequent sessions.
A strong daily advance is encouraging, but the next step is to assess the quality of the breakout, trading volume and the stock’s position relative to key support and resistance levels. A move above a psychological price threshold does not, by itself, confirm a durable uptrend.
Meta Platforms: Continued Weakness
Meta Platforms (META) declined 1.24% on Tuesday, underperforming the broader market.
The contrast between Tesla’s gain and Meta’s decline illustrates the selective nature of the technology trade. Even when the Nasdaq advances strongly, individual companies can move in opposite directions.
Traders should evaluate META’s price structure and support levels independently rather than assuming that strength across the broader technology sector will automatically lift every large-cap stock.
Broadcom: AI Infrastructure Financing Deal in Focus
Broadcom (AVGO) advanced on news related to a reported $63 billion transaction involving AI computing capacity for Anthropic.
According to the supplied information, the arrangement is intended to support the deployment of AI compute capacity using Broadcom technology. Bank of America (BAC), Blackstone (BX), Citi (C) and Morgan Stanley (MS) were identified as the lead financial partners.
The transaction highlights the continued investment required to build AI computing infrastructure, including the chips, networking technology and computing capacity needed to support large-scale AI systems.
For investors, Broadcom’s position in AI infrastructure remains an important area to follow. However, the financial significance of the transaction should be evaluated in the context of its structure, execution, revenue recognition and expected contribution to Broadcom’s business.
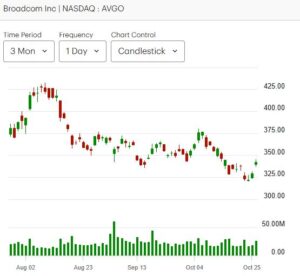
Traders should also distinguish between the immediate market reaction to an AI-related announcement and evidence of a sustained improvement in the stock’s technical trend.
Semiconductor Stocks: A Broad Rebound, but Technical Damage Remains
Semiconductor stocks recorded solid gains on Tuesday, with a few notable exceptions, including Texas Instruments (TXN) and Analog Devices (ADI).
The rebound extended to several AI hardware and infrastructure-related stocks, although NetApp (NTAP) was among the exceptions identified in the supplied notes.
The gains are encouraging after the recent weakness affecting many semiconductor charts. However, a strong session does not necessarily reverse the technical damage accumulated during a prolonged decline.
Traders should focus on whether individual stocks can reclaim important moving averages, break through resistance and sustain those moves with supportive volume. Stocks that remain below key technical levels may still be vulnerable to renewed selling.
For investors, the longer-term AI infrastructure theme remains relevant, but company valuations, earnings expectations and the sustainability of capital spending must be assessed individually.
.
After-Hours and Earnings Developments
The following developments were reported in the supplied after-hours notes. Extended-hours price movements can change before the next regular session, so traders should confirm the latest quotes and company announcements before acting.
Seagate Technology (STX)
Seagate reportedly fell sharply in extended trading despite strong earnings and guidance. This reaction illustrates how expectations can influence stock prices: results that appear strong in isolation may still disappoint investors if they fail to exceed what the market had already priced in.
Traders should examine management guidance, the market’s prior expectations and the stock’s reaction during the next regular session before drawing conclusions about the move.
SK Hynix, Micron and Sandisk
SK Hynix reportedly rose modestly overnight following strong earnings and guidance, after its shares had declined substantially in recent weeks.
The results appeared to support sentiment toward U.S. memory-related stocks, including Micron Technology (MU) and Sandisk (SNDK). Sandisk was also approaching an upcoming earnings announcement, according to the supplied notes.
For semiconductor traders, memory pricing, demand expectations and forward guidance are important variables. However, sympathy gains in related stocks do not guarantee that their own earnings reports will produce similar reactions.
The Cheesecake Factory (CAKE)
The Cheesecake Factory reportedly declined modestly in extended trading and was approaching its 50-day moving average after pulling back from prior buy points.
Traders should watch whether the stock holds this technical reference level or breaks below it. A failed support level can change the risk-reward profile of an existing position, particularly when a stock has already retreated from a potential breakout area.
Visa (V)
Visa reportedly edged lower but remained within a previously identified buy zone.
Traders should verify the relevant entry range and current technical setup before treating the stock as actionable. Remaining within a buy zone is not a guarantee of further gains, and risk controls remain important.
Market Internals: Positive Daily Breadth, Weak Underlying Condition
Tuesday’s market statistics provided an important qualification to the positive index performance.
On the NYSE, advancing issues outnumbered declining issues by approximately 1.83 to 1. On NASDAQ, the ratio was approximately 1.90 to 1. These figures indicate that Tuesday’s gains were supported by broad positive daily breadth.
However, the new-high/new-low indicators remained weak.
| Market Indicator | NYSE | NASDAQ |
|---|---|---|
| New 52-week highs | 81 | 85 |
| New 52-week lows | 146 | 289 |
| New-high/new-low ratio | 0.55:1 | 0.29:1 |
On the NYSE, new 52-week lows fell from 286 to 146, a decline of approximately 49%. New highs declined from 114 to 81, or approximately 29%.
On NASDAQ, new lows fell from 436 to 289, a decline of approximately 34%, while new highs declined from 116 to 85, or approximately 27%.
The decline in new lows is encouraging, but the number of stocks reaching fresh annual lows still exceeded the number reaching new highs on both exchanges. The imbalance was particularly pronounced on NASDAQ.
Trading volume also presented a mixed picture. NYSE volume was reported to have declined approximately 11%, while NASDAQ volume increased by approximately 7%, based on the figures supplied.
The key message is that positive daily breadth and rising index prices have not yet been accompanied by a decisive recovery in the new-high/new-low relationship. A sustained improvement in market internals would require new lows to continue declining and, ultimately, new highs to consistently outnumber new lows.
Technical Outlook: A Rebound, Not Yet a Confirmed Recovery
Tuesday’s gains improved the short-term market picture, but the major indexes remain in different technical positions.
- Dow Jones: Above its 25-day, 50-day and 200-day moving averages, making it the strongest technically positioned major index in this comparison.
- S&P 500: Above its 200-day moving average but below its 25-day and 50-day moving averages.
- Nasdaq Composite: Posted the strongest daily gain but remains below its 25-day and 50-day moving averages.
- Russell 2000: Remains below all three key moving averages and requires further recovery.
The 50-day moving average is an important reference for traders assessing intermediate-term momentum. A sustained recovery above that level by the Nasdaq and S&P 500 would improve their technical outlook, while the Russell 2000 needs to overcome more substantial resistance to establish a stronger trend.
At the same time, moving averages should be used alongside price structure, volume, breadth and individual trading plans rather than as standalone buy or sell signals.
Key Takeaways for Traders and Investors
1. Tuesday’s market advance was constructive. All four major indexes rose for a second consecutive session, with the Nasdaq and Russell 2000 leading.
2. Technology and semiconductor stocks deserve close attention. Their rebound could help sustain the Nasdaq’s recovery, but traders should distinguish between a one-day bounce and a confirmed technical reversal.
3. Market internals remain the main concern. New 52-week lows continued to exceed new highs on both exchanges, particularly on NASDAQ. This suggests that many individual stocks remain vulnerable despite the index gains.
4. Watch the 50-day moving average. A sustained recovery above this level by the Nasdaq and S&P 500 would provide stronger evidence of improving intermediate-term momentum.
5. Earnings reactions can be unpredictable. Seagate’s reported decline despite strong results highlights the importance of expectations and forward guidance. Traders should avoid assuming that good earnings automatically translate into higher share prices.
6. Manage exposure carefully. Until market internals strengthen consistently, traders should be selective with new positions, avoid chasing extended moves and establish clear exit criteria.
Final Assessment
Tuesday was a positive session for U.S. equities. All four major indexes advanced for a second consecutive day, technology and semiconductor stocks rebounded, and advancing issues outnumbered declining issues on both the NYSE and NASDAQ.
Nevertheless, the market’s underlying condition remains fragile. New 52-week lows continued to exceed new highs, while the Nasdaq and S&P 500 remained below their 25-day and 50-day moving averages. The Russell 2000 also remained below its 200-day moving average.
For traders, the immediate priority is to determine whether Tuesday’s gains develop into a sustained recovery supported by stronger technical action, volume and market internals. For investors, the rebound is encouraging but does not yet provide definitive evidence that the broader market has returned to a healthy upward trend.
A more convincing bullish outlook would require several consecutive constructive sessions, improving new-high/new-low readings and sustained recoveries above key technical levels. Until then, disciplined risk management and selective stock picking remain essential.
.
NOTICE TO READERS
The Canadian Vanguard Stock Market is about empowering you to build and manage your wealth by yourself. There is certainly no magic in managing finances or wealth but one needs to know what to do and commit to doing what is needed. When you are ready to start the journey to Take Charge and Put Your Destiny In Your Own Hands, start with reading The Canadian Vanguard every market day. If and when you need more related information or to advertise your business products or services in The Canadian Vanguard, Contact Us
Our readers are strongly advised to conduct their own research into individual stocks before making a purchase decision. In addition, investors are advised that past stock performance is no guarantee of future price appreciation. Any recommendation is not a guarantee of any particular stock’s future prices, and The Canadian Vanguard accepts no responsibility or liability for investors’ or readers’ purchases.
The dollar sign “$” in the Toronto Market section in the articles only stands for Canadian dollar and in the US market section “$” stands for US dollar.
(c) This article is published by The Canadian Vanguard on October 27, 2026