







Markets retreat as geopolitical tension and Oil price increase weigh markets down
The Canadian Vanguard Stock Market Report – Wednesday October 21, 2026 Edition
.
The Toronto Market
Thursday’s Toronto Market Index
The S&P/TSX Composite Index fell 351.54 points, or 0.97%, to close at 35,973.45 on Thursday.


The TSX joined most other major North American indexes in ending the session sharply lower, with the Dow Jones Industrial Average being a notable exception. The decline pushed the index back below the psychologically important 36,000 level as renewed geopolitical tensions in the Middle East weighed on market sentiment. Overall, it was a decidedly negative trading session for Canadian equities.
Despite Thursday’s pullback, the TSX Composite Index remains above its 25-day and 50-day moving averages. It also continues to trade comfortably above its 200-day moving average, suggesting that the broader technical trend remains positive despite the recent weakness.
Thursday’s TSX Market Statistics
Market breadth on the Toronto Stock Exchange (TSX) turned decisively negative on Thursday, with 1,417 declining issues outnumbering 828 advancing issues. This represents a decliner-to-advancer ratio of approximately 1.71:1, or roughly eight decliners for every five advancers. Another 113 issues remained unchanged.
The TSX therefore reversed from Wednesday’s relatively bullish session to a bearish trading session, with negative market breadth reflecting widespread selling pressure. The recent fluctuations in the decliner-to-advancer ratio also suggest that market participation has become increasingly unstable.
The exchange recorded 89 new 52-week highs and 132 new 52-week lows, compared with 66 new highs and 45 new lows on Wednesday. The number of new highs increased by approximately 35%, while new lows surged by about 193% compared with the previous session.
The ratio of new 52-week highs to new 52-week lows stood at approximately 0.67:1, or 2:3, on Thursday, compared with 1.47:1 on Wednesday. Despite the increase in new highs, the sharp rise in new lows indicates that underlying market conditions remain weak. Overall, the market internals showed a mixed picture, but the balance of evidence points to continued deterioration in market breadth.
Total trading volume on the TSX reached 510,504,922 shares, approximately 24% higher than Wednesday’s volume of 411,147,553 shares. The increase in trading activity, combined with the negative market breadth and the greater number of new 52-week lows, suggests that Thursday’s decline occurred amid heightened market participation.
Market outlook: Investors should continue to exercise caution as the TSX alternates between positive and negative sessions. Although the market may stabilize and regain upward momentum in the short term, sustained improvement in market breadth and a healthier balance between new 52-week highs and lows would provide stronger evidence of a recovery. We will continue monitoring these indicators for signs of stabilization or further weakness.
Thursday’s Toronto Stock Exchange (TSX) Market Wrap-Up Report
Market Overview: Sharp Sell-Off Amid Sector Rotation
The Toronto stock market came under significant selling pressure on Thursday, with the S&P/TSX Composite Index falling 351.54 points, or 0.97%, to close at 35,973.45. The decline pushed the benchmark index back below the psychologically important 36,000 level as renewed geopolitical tensions in the Middle East and rising oil prices weighed on broader market sentiment.
Interestingly, despite the weakness in the overall market, seven of the ten major sectors advanced, suggesting that Thursday’s sell-off was not uniform across the market. Telecommunications Services led the gainers, rising a substantial 3.61%. Durable Consumer Goods & Services advanced 2.35%, Utilities gained 1.42%, and Industrials rose 1.19%. Discretionary Consumer Goods & Services also posted a solid gain of 1.10%.
On the downside, Basic Materials was the worst-performing sector, plunging 5.49%. Energy declined 1.29%, while Technology fell 1.25%.
The strength in Telecommunications Services, Utilities, and consumer-oriented sectors suggests a possible rotation toward more defensive or relatively resilient areas of the market. However, the decline in Energy shares, despite rising oil prices, is particularly noteworthy. It suggests that higher crude prices alone were insufficient to support energy equities amid broader market uncertainty and selling pressure.
Overall, Thursday’s sector performance reflected a mixed market beneath the headline decline, with investors favouring selected sectors while reducing exposure to others. Further sessions will be needed to determine whether this represents a sustained defensive rotation or a temporary shift in positioning.
Canadian Big Six Banks: Broad-Based Weakness
Canada’s major banks mostly finished lower on Thursday, reflecting the generally cautious tone across the domestic equity market. Toronto-Dominion Bank (TD) was the only member of the Big Six to finish in positive territory, although its gain was marginal.
- Toronto-Dominion Bank (TD): Rose 0.03% to close at $174.14, with approximately 5.0 million shares traded. TD was the strongest performer among the Big Six, although the modest gain indicates limited upward momentum.
- National Bank of Canada (NA): Declined 0.08% to close at $207.31, with 2.2 million shares traded. The stock showed relative resilience compared with the weaker performers in the group.
- Bank of Nova Scotia (BNS): Fell 0.89% to $130.72, with 3.2 million shares traded. BNS was the weakest performer among the six major banks.
- Canadian Imperial Bank of Commerce (CM): Slipped 0.21% to close at $161.00, with 2.2 million shares traded.
- Bank of Montreal (BMO): Declined 0.25% to $238.70, with 1.9 million shares traded.
- Royal Bank of Canada (RY): Fell 0.30% to close at $282.78, with 3.9 million shares traded.
The broad weakness across the banking group suggests that investors remained cautious toward Canadian financial stocks. TD’s marginal advance was a relative bright spot, but it was not strong enough to signal meaningful sector leadership. Traders should monitor whether the banks stabilize in subsequent sessions or experience further selling pressure alongside the broader market.
Selected Company Highlights
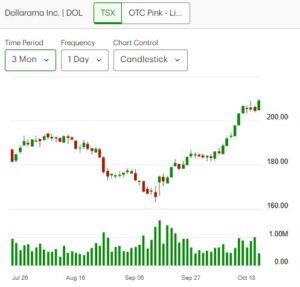
Dollarama Inc. (DOL) was among Thursday’s notable gainers, rising 2.20% to close at $209.13, with approximately 429,000 shares traded. Its positive performance stood out against the broader market decline and was consistent with investor interest in selected consumer-oriented businesses. However, one session alone is insufficient to establish a sustained trend.
Shopify Inc. (SHOP) was under significant pressure, falling 3.14% to close at $168.81, with approximately 10.9 million shares traded. The elevated trading volume highlights the importance of monitoring the stock’s price action in the coming sessions. Shopify appears to be in a consolidation phase, and traders should watch for a decisive breakout or breakdown before drawing conclusions about its next directional move.
Market Internals: Selling Pressure Intensifies
Thursday’s market statistics painted a distinctly bearish picture beneath the headline index performance.
Declining issues totalled 1,417, compared with 828 advancing issues, while 113 issues remained unchanged. This produced a decliner-to-advancer ratio of approximately 1.71:1, indicating that declining stocks substantially outnumbered advancing stocks.
The deterioration was also evident in the exchange’s 52-week highs and lows. The TSX recorded 89 new highs and 132 new lows, compared with 66 new highs and 45 new lows on Wednesday. New highs increased by approximately 35%, but new lows surged by approximately 193%.
The ratio of new 52-week highs to new lows fell sharply, from approximately 1.47:1 on Wednesday to 0.67:1 on Thursday. This shift indicates that weakness among stocks reaching new lows became considerably more widespread, despite the increase in new highs.
Trading activity also increased. Total TSX volume reached approximately 510.5 million shares, up 24% from Wednesday’s 411.1 million shares.
Taken together, the negative advance-decline balance, the greater number of new lows, and the increase in trading volume suggest that Thursday’s decline was accompanied by broad selling pressure. These internal indicators warrant close attention, particularly if the benchmark index continues to weaken.
From a technical perspective, the TSX Composite Index remains above its 25-day and 50-day moving averages and continues to trade comfortably above its 200-day moving average. This suggests that the broader trend has not yet been decisively broken, despite Thursday’s setback. Nevertheless, a sustained decline in market breadth could undermine the index’s technical resilience if weakness persists.
Key Takeaways for Traders and Investors
- Respect the weakening market breadth. With decliners outnumbering advancers by approximately 1.71 to 1 and new 52-week lows exceeding new highs, traders should be cautious about assuming that the market’s underlying weakness is over.
- Watch the 36,000 level. The TSX’s close below this psychologically important threshold makes it a level worth monitoring. A sustained recovery above it could improve sentiment, while continued weakness could increase selling pressure. Price confirmation is more useful than the level alone.
- Monitor sector rotation carefully. Strength in Telecommunications Services, Utilities, and selected consumer sectors contrasted with weakness in Basic Materials, Energy, and Technology. Traders should distinguish between genuine sector leadership and temporary defensive positioning.
- Keep an eye on the major banks. Five of the six largest Canadian banks declined, and TD’s marginal gain offered little evidence of broad financial-sector strength. Their subsequent performance may help clarify the market’s appetite for major Canadian equities.
- Use disciplined risk management. Rising trading volume alongside negative breadth suggests that caution is warranted. Traders may wish to reduce excessive exposure, avoid chasing short-lived rebounds, and use predefined entry, exit, and position-sizing rules.
- Look for confirmation before turning bullish. The TSX remains above its 25-day, 50-day, and 200-day moving averages, but improving breadth, a stronger balance between new highs and lows, and sustained price recovery would provide more convincing evidence that market conditions are stabilizing.
Closing Outlook
Thursday’s session highlighted the contrast between the TSX’s still-positive longer-term technical positioning and deteriorating short-term market internals. Defensive sector strength and selected individual stock gains offered some support, but the broader advance-decline balance, the surge in new 52-week lows, and higher trading volume pointed to increased market fragility.
With geopolitical developments and oil-price movements continuing to influence sentiment, investors should be prepared for further volatility. The key question in the sessions ahead is whether the TSX can regain upward momentum and improve its market breadth, or whether Thursday’s weakness develops into a more sustained correction.
For now, a cautious, selective approach appears appropriate. Traders should remain alert to changes in sector leadership, market breadth, and the index’s relationship with its key moving averages before committing to more aggressive directional positions.
.
The US Markets
Thursday’s U.S. Market Indexes: Technology Sell-Off Weighs on Wall Street
Market Overview
U.S. stock markets came under significant pressure on Thursday, with three of the four major market indexes finishing lower. The Dow Jones Industrial Average and the Russell 2000 were the exceptions to the broader weakness, managing modest gains as technology and semiconductor stocks faced heavy selling.
The Dow Jones Industrial Average rose 11.89 points, or 0.02%, to close at 52,867.98. The S&P 500 declined 93.74 points, or 1.21%, to finish at 7,663.43. The Nasdaq Composite suffered the steepest decline, plunging 694.00 points, or 2.60%, to close at 26,008.86. Meanwhile, the Russell 2000 edged up 3.01 points, or 0.11%, to finish at 2,784.03.
Thursday’s session was characterized by significant selling pressure in technology stocks, particularly semiconductor companies and businesses associated with artificial intelligence (AI) infrastructure. The Nasdaq Composite was the hardest-hit major index, reflecting its substantial exposure to technology and growth-oriented stocks.
Rising oil prices, renewed geopolitical uncertainty, and concerns about the potential returns on massive AI infrastructure investments contributed to an increasingly challenging market environment. These factors appear to have intensified investor caution and added to volatility across equities.
Technology Stocks Under Pressure
Technology stocks were among the principal drivers of Thursday’s market decline. Semiconductor companies and AI infrastructure-related stocks experienced substantial selling pressure, raising concerns about the sustainability of valuations in parts of the technology sector.
The Nasdaq Composite was particularly vulnerable because of its heavy weighting in technology companies. When these stocks experience widespread selling, their combined influence can exert considerable downward pressure on the index. Thursday’s 2.60% decline illustrated this vulnerability.
The S&P 500 was also significantly affected. Although the index is more diversified than the Nasdaq, its substantial exposure to large technology companies means that weakness in this sector can have an outsized impact on its overall performance.
The selling pressure also points to a possible rotation away from technology stocks, especially semiconductor companies. Investors appear increasingly focused on whether the anticipated returns from AI-related capital expenditures will justify the substantial investments being made in data centers, computing infrastructure, and related technologies.
Rising oil prices and geopolitical tensions added to the uncertainty. Higher energy costs could intensify inflationary pressures, complicate the outlook for interest rates, and weigh on corporate profit expectations. Together, these concerns may continue to influence investor positioning and market direction.
Although Thursday’s decline was substantial, further trading sessions will be needed to determine whether the technology sell-off develops into a broader market correction or proves to be a temporary period of volatility.
Technical Outlook: Major Indexes and Moving Averages
The latest technical readings suggest that short-term momentum has weakened in the Nasdaq Composite and S&P 500, while the Russell 2000 continues to face a more challenging technical environment.
- Nasdaq Composite: The index is now clearly below both its 25-day and 50-day moving averages, signaling deteriorating short-term momentum. However, it remains comfortably above its 200-day moving average. This suggests that the longer-term trend has not yet been decisively broken, despite the sharp decline.
- S&P 500: The index has slipped just below its 25-day and 50-day moving averages, indicating increased short-term vulnerability. It remains well above its 200-day moving average, suggesting that its longer-term technical position is still relatively resilient. A recovery above the shorter-term averages would provide an encouraging signal, while continued weakness could increase downside risk.
- Dow Jones Industrial Average: The Dow edged higher on Thursday and, according to the supplied technical observations, remains above its 25-day and 50-day moving averages while trading comfortably above its 200-day moving average. This positioning suggests comparatively stronger technical momentum than that of the Nasdaq and S&P 500.
- Russell 2000: Despite Thursday’s modest gain, the Russell 2000 remains below its 25-day, 50-day, and 200-day moving averages. This indicates that the small-cap index continues to face significant technical headwinds. One positive session is not sufficient to establish a sustained recovery.
Overall, the technical picture is mixed but increasingly cautious. The Nasdaq and S&P 500 have weakened below their shorter-term moving averages, while the Russell 2000 remains below all three major averages. The Dow’s relative strength is encouraging, although its modest gain alone does not establish a broader market recovery.
Key Takeaways for Traders and Investors
- Monitor technology and semiconductor stocks closely. The Nasdaq’s sharp decline highlights the influence of technology stocks on overall market performance. Continued weakness in semiconductor and AI infrastructure companies could place additional pressure on the broader indexes.
- Watch the S&P 500’s short-term technical levels. Its position below the 25-day and 50-day moving averages suggests weakening momentum. A sustained recovery above these averages could indicate improving conditions, while further declines would warrant greater caution.
- Pay attention to the Russell 2000. Its position below all three major moving averages indicates persistent weakness in small-cap stocks. A sustained move back above these levels would provide more convincing evidence of stabilization.
- Evaluate the sustainability of AI investment spending. Concerns about returns on AI infrastructure investments may continue to influence valuations across semiconductor manufacturers, data-centre operators, and major technology companies. Earnings reports, capital expenditure plans, and forward guidance will be important indicators to watch.
- Factor oil prices and geopolitical risks into trading decisions. Rising oil prices and escalating geopolitical tensions could contribute to inflation concerns and further market volatility. Traders should remain alert to changes in these developments.
- Distinguish short-term weakness from a longer-term trend reversal. Although the Nasdaq and S&P 500 have fallen below their shorter-term moving averages, both remain above their 200-day moving averages. A sustained break below these longer-term indicators would represent a more significant deterioration in their technical outlook.
- Maintain disciplined risk management. In a volatile environment, traders should avoid chasing sharp price movements and consider position sizing, predefined exit levels, and confirmation signals before entering directional trades.
Closing Outlook
Thursday’s trading session underscored the vulnerability of U.S. equities to concentrated selling in technology and semiconductor stocks. The Nasdaq Composite suffered the largest decline, while the S&P 500 also experienced a significant setback. The Dow Jones Industrial Average and Russell 2000 managed modest gains, but their positive performances were not sufficient to offset the broader market weakness.
The combination of rising oil prices, geopolitical uncertainty, and questions about the returns on AI infrastructure investments continues to create an uncertain environment for investors. The weakening technical positions of the Nasdaq and S&P 500 warrant close monitoring, while the Russell 2000’s position below all three major moving averages remains a concern.
For traders and investors, the immediate priority is to determine whether the technology sell-off will persist, whether the S&P 500 can regain its shorter-term moving averages, and whether the Russell 2000 can begin to stabilize. Until clearer signs of improvement emerge, a selective approach and disciplined risk management remain prudent.
Thursday’s U.S. Market Statistics: Mixed Breadth and Persistently Weak Market Internals
New York Stock Exchange (NYSE)
Market Breadth: Barely Positive
Market breadth on the New York Stock Exchange was marginally positive on Thursday, with advancing issues narrowly outnumbering declining issues. The exchange recorded 2,346 advancers, 2,314 decliners, and 486 unchanged issues, producing an advancer-to-decliner ratio of approximately 1.01:1. In practical terms, there was barely one advancing stock for every declining stock.
Although the advance-decline balance edged into positive territory, it offered little evidence of broad-based market strength. The near-even split between advancers and decliners suggests that participation remained weak despite the positive reading.
New 52-Week Highs and Lows: Improvement in Both, but Weakness Persists
The NYSE recorded 173 new 52-week highs and 366 new 52-week lows on Thursday, compared with 131 new highs and 221 new lows on Wednesday.
The number of new highs increased by approximately 32%, while new lows rose by about 66%. Although more stocks reached new highs, the substantially larger number of new lows indicates that underlying market weakness remains a concern.
The ratio of new 52-week highs to new 52-week lows improved from approximately 0.59:1 on Wednesday to 0.47:1 on Thursday. This is equivalent to roughly 47 new highs for every 100 new lows, compared with 59 for every 100 the previous session.
Consequently, the improvement in new highs did not translate into a healthier overall balance between stocks reaching new highs and new lows. The continued predominance of new lows suggests that weakness remains widespread beneath the surface of the broader market.
Trading Volume: A Significant Increase
Total NYSE trading volume reached 6,068,764,971 shares, approximately 21% higher than Wednesday’s volume of 5,009,569,461 shares.
The increase in trading activity indicates greater market participation during Thursday’s session. However, higher volume is not inherently bullish or bearish; it must be interpreted alongside price movements and market breadth. Given the nearly balanced advance-decline figures and the larger number of new lows, Thursday’s higher volume does not, by itself, establish a meaningful improvement in market conditions.
NYSE Assessment
The NYSE’s internal indicators remain weak, despite a marginally positive advance-decline balance and an increase in the number of new 52-week highs. The continued excess of new lows over new highs is particularly concerning.
Traders and investors should remain cautious. Geopolitical tensions, economic developments, interest-rate expectations, and other global factors can quickly change market direction. In this environment, disciplined position sizing, predefined exit levels, and close monitoring of market breadth are especially important.
NASDAQ
Market Breadth: Decliners Remain in Control
NASDAQ market breadth was negative on Thursday, with declining issues substantially outnumbering advancing issues. The exchange recorded 2,828 decliners, 2,093 advancers, and 374 unchanged issues.
This produced a decliner-to-advancer ratio of approximately 1.35:1, meaning there were about seven declining stocks for every five advancing stocks.
The negative advance-decline balance indicates that selling pressure remained broad across NASDAQ-listed securities. Even if the index itself records a gain, weak participation among individual stocks can signal that the recovery lacks a solid foundation.
New 52-Week Highs and Lows: Some Improvement, but Weak Internals Persist
NASDAQ recorded 114 new 52-week highs and 459 new 52-week lows on Thursday, compared with 81 new highs and 255 new lows on Wednesday.
The number of new highs increased by approximately 41%, while new lows rose by about 80%. Although more stocks reached new highs, the number of stocks reaching new lows increased even faster.
The ratio of new 52-week highs to new 52-week lows consequently declined from approximately 0.32:1 on Wednesday to 0.25:1 on Thursday. In other words, there were about 25 new highs for every 100 new lows, compared with approximately 32 the previous session.
These figures indicate that NASDAQ’s longer-term market internals remain weak. The persistent predominance of new lows suggests that a considerable number of individual stocks continue to struggle, even when some large-cap stocks help support the headline index.
Trading Volume: Higher Participation Requires Context
Total NASDAQ trading volume reached 9,357,570,517 shares, approximately 14% higher than Wednesday’s volume of 8,184,888,737 shares.
The increase in volume indicates greater trading activity, but its significance depends on the direction of the index and the breadth of participation. Stronger index performance accompanied by higher volume can be constructive when advancing stocks are broadly participating. However, negative advance-decline breadth and a continued excess of new lows would weaken that bullish interpretation.
Accordingly, traders should avoid treating higher NASDAQ volume as a bullish signal in isolation. The relationship between index performance, trading volume, and underlying market breadth remains essential.
NASDAQ Assessment
NASDAQ’s market internals remain weak, particularly in the new-high/new-low data and the advance-decline balance. Although the number of new highs increased, new lows continued to outnumber them substantially.
A more convincing improvement would require sustained progress across several indicators: advancing issues consistently outnumbering decliners, new highs gaining ground relative to new lows, and stronger participation across a wider range of stocks.
Until such improvement becomes evident, traders should remain selective and avoid assuming that strength in a handful of large technology companies necessarily reflects a broad-based recovery.
Key Takeaways for Traders and Investors
- Do not rely on headline index performance alone. Market breadth can reveal weaknesses that are not immediately apparent from the major indexes. A market advance supported by only a narrow group of stocks may be less sustainable than one supported by broad participation.
- Monitor the new-high/new-low ratio. On both exchanges, new 52-week lows substantially exceeded new highs. A sustained narrowing of this gap would provide more convincing evidence of improving underlying conditions.
- Interpret trading volume in context. Higher volume can accompany accumulation or distribution. It becomes more informative when considered alongside index direction, advance-decline statistics, and the balance between new highs and new lows.
- Be cautious with NASDAQ exposure. The negative advance-decline balance and persistent predominance of new lows indicate that weakness extends beyond a few individual stocks. Traders should watch for broader participation before treating a rally as a confirmed recovery.
- Use disciplined risk management. Geopolitical developments, economic data, and changes in interest-rate expectations can trigger abrupt market reversals. Consider predefined stop-loss levels, appropriate position sizing, and clear conditions for exiting a trade.
- Look for confirmation across multiple indicators. A more durable improvement would ideally involve stronger advance-decline readings, fewer new lows relative to new highs, and price gains supported by healthy trading activity.
Closing Outlook
Thursday’s market statistics presented a mixed but predominantly cautious picture. The NYSE achieved marginally positive breadth, while NASDAQ recorded more declining than advancing issues. On both exchanges, new 52-week lows continued to outnumber new highs, indicating that underlying market weakness remains significant.
Trading volume increased on both exchanges, reflecting heightened activity but not necessarily a decisive shift in market direction. Without broader improvement in market breadth and the new-high/new-low balance, it would be premature to conclude that market conditions have stabilized.
For traders and investors, the priority should be to monitor the quality of any market rebound rather than simply its magnitude. Sustained improvement in breadth, participation, and the balance between new highs and new lows would provide stronger evidence of recovery. Until then, a cautious, selective approach remains appropriate.
Thursday’s U.S. Market Wrap-Up Report
Technology Sell-Off Deepens as Investors Reassess AI Spending and Market Risks
Market Overview: Dow Holds Steady as Technology Stocks Come Under Pressure
U.S. equity markets endured a difficult session on Thursday, with the Dow Jones Industrial Average managing a marginal gain while the S&P 500 and Nasdaq Composite suffered significant losses. The Russell 2000 also edged higher, but its modest advance did little to offset the broader weakness in technology stocks.
The Dow Jones Industrial Average rose 11.89 points, or 0.02%, to close at 52,867.98. The S&P 500 fell 93.74 points, or 1.21%, to finish at 7,663.43, while the Nasdaq Composite plunged 694.00 points, or 2.60%, to close at 26,008.86. The Russell 2000 gained 3.01 points, or 0.11%, to finish at 2,784.03.
Technology stocks, particularly semiconductor companies and businesses connected to artificial intelligence (AI) infrastructure, were among the session’s weakest performers. Investors appeared increasingly concerned about the scale of AI-related capital expenditures and whether the anticipated returns would justify the enormous investments being made.
The weakness in the Nasdaq also weighed on the S&P 500, whose substantial exposure to large technology companies makes it vulnerable to concentrated selling in the sector. Thursday’s session highlighted the extent to which technology-related concerns can influence the direction of the broader U.S. equity market.
Sector Rotation: Consumer-Oriented and Defensive Groups Show Resilience
Despite the broad market weakness, selected sectors demonstrated resilience. Consumer Discretionary Goods & Services led the reported sector gainers, advancing 3.07%. Telecommunications Services rose 2.82%, Healthcare gained 1.20%, and Financials edged higher by 0.26%.
The relative strength in consumer-oriented and defensive sectors suggests a possible rotation away from some technology stocks toward other areas of the market. However, the available sector figures do not establish whether this rotation is broad-based or likely to persist.
The contrast between the strength in selected sectors and the sharp decline in the Nasdaq suggests that Thursday’s selling was concentrated in areas of the market that had benefited from strong enthusiasm surrounding AI and technology-related investment.
For traders, this divergence is worth monitoring. Sustained leadership from sectors outside technology could indicate a broader change in investor preferences, while a recovery in semiconductor and AI-related stocks could help stabilize the major indexes.
Treasury Yields: The 5% Threshold Remains Important
The U.S. 10-year Treasury yield moved lower and, according to the supplied market observations, remained below the psychologically important 5% threshold.
Bond yields are an important consideration for equity investors because they influence borrowing costs, corporate valuations, and the relative attractiveness of stocks compared with fixed-income investments. Higher yields can place additional pressure on growth stocks, whose valuations often depend heavily on expectations for earnings far into the future.
A yield below 5% may provide some relief to equity markets, particularly growth-oriented companies. However, Thursday’s technology sell-off demonstrates that lower yields alone may not be sufficient to support stock prices when investors are concerned about capital spending, valuations, and future profitability.
Traders should monitor Treasury yields alongside technology earnings, corporate guidance, and broader market breadth rather than treating the 5% threshold as a stand-alone buy or sell signal.
Company News: Western Digital Faces Selling Pressure Despite Strong Results
Western Digital (WDC) reported fiscal first-quarter results that exceeded analysts’ revenue expectations, but the stock remained under pressure amid a broader retreat from AI-connected companies.
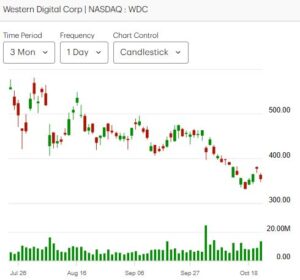
The company reported revenue of $4.38 billion, up from $2.82 billion a year earlier and above analysts’ expectations of $4.14 billion. Net income increased to $1.78 billion, or $4.63 per share, compared with $1.15 billion, or $3.07 per share, in the year-earlier quarter.
Western Digital also announced a 17% increase in its quarterly dividend to $0.175 per share.
Despite these encouraging financial results, the stock fell 6.4% during regular trading to close at $354.19. It subsequently declined a further 5.6% after the market close, reaching $334.51 in after-hours trading, according to the supplied figures.
The reaction illustrates an important lesson for investors: strong earnings do not always translate into immediate share-price gains. Expectations, valuation, forward guidance, and broader market sentiment can all influence how investors respond to an earnings announcement.
Western Digital has benefited from growing demand for data storage and computing infrastructure. Its hard disk drives serve data-intensive applications, including cloud storage and enterprise computing. Although AI-related demand can support the broader data-storage industry, the company’s outlook should also be assessed in terms of traditional storage demand, pricing, margins, and future earnings.
The stock’s substantial gains earlier in the year may also have left it vulnerable to profit-taking. Its recent decline could create an opportunity if the underlying business outlook remains strong, but a recovery should not be assumed simply because the shares have fallen.
What traders should watch: Western Digital’s subsequent price action, trading volume, forward guidance, and ability to stabilize following the earnings announcement. A sustained recovery would provide more convincing evidence of renewed buying interest than a single-session rebound.
Meta Platforms: AI Spending and Future Financing Needs in Focus
Meta Platforms (META) remained at the centre of investor discussions about the cost of AI infrastructure and the financing required to support future expansion.
According to the supplied report, Meta disclosed plans to create a new class of nonvoting shares, potentially allowing the company to issue equity without diluting founder and CEO Mark Zuckerberg’s voting control. Zuckerberg reportedly holds approximately 60% of Meta’s voting power through super voting shares, while his economic ownership is approximately 14%.
The proposed share structure was described as involving a one-for-one distribution of new nonvoting shares to existing shareholders, economically resembling a two-for-one stock split. The structure and timing of any future equity financing remain important considerations for investors.
More broadly, Meta’s disclosures highlighted the scale of its potential funding requirements. The company indicated that it could seek to raise hundreds of billions of dollars over several years, beginning as early as fall 2026, to support future financing needs.
The company also pointed to an increasingly challenging environment for raising capital, suggesting that it may be advantageous to secure funding before other large companies compete for the same pool of investment capital. Potential fundraising by major AI companies, including Anthropic, could add to competition for capital.
For investors, the central issue is not simply whether Meta can raise the money. It is whether the company can generate sufficient returns on its AI investments to justify the financial commitment.
Large infrastructure expenditures can support future growth, but they can also increase depreciation, operating costs, and financing requirements. If revenue and earnings growth fail to keep pace with investment, shareholders may become less willing to support elevated valuations.
Meta’s financing plans therefore represent an important development for the broader technology sector, particularly for companies whose valuations depend on expectations of continued AI-related spending.
European ADRs: Modest Weakness in U.S. Trading
European equities traded in the United States through American depositary receipts (ADRs) were also under pressure on Thursday.
The S&P Europe Select ADR Index declined 0.96% to 1,894.88 in late-morning trading, according to the supplied report.
Among continental European companies, software firm SAP (SAP) advanced 3.6%, while brewing company Anheuser-Busch InBev (BUD) gained 2.7%. Consumer goods company Unilever (UL) also rose 2.7%, and biopharmaceutical company DBV Technologies (DBVT) advanced 0.9%.
These individual gains offered some relative strength amid the broader weakness in European ADRs. However, the index’s decline indicated that the overall group remained under pressure.
For investors following international equities, the performance of European ADRs provides an additional reference point for assessing global sentiment, although these securities do not necessarily move in line with their home-market indexes throughout the trading day.
Market Internals and Technical Outlook
Thursday’s market statistics suggest that the broader market remains vulnerable despite pockets of resilience.
On the New York Stock Exchange, advancing issues narrowly outnumbered declining issues, with 2,346 advancers against 2,314 decliners. The resulting advance-decline ratio of approximately 1.01:1 indicated barely positive breadth.
However, new 52-week lows substantially exceeded new highs, with 366 new lows against 173 new highs. Trading volume also increased by approximately 21% from the previous session.
NASDAQ presented a weaker picture. Declining issues outnumbered advancing issues by approximately 1.35:1, while 459 stocks reached new 52-week lows compared with only 114 new highs. Trading volume rose by approximately 14%.
These figures suggest that underlying market conditions remain fragile. Although the NYSE’s advance-decline balance was marginally positive, the large number of new lows on both exchanges indicates that many individual stocks continue to struggle.
The technical picture for the major indexes also warrants caution:
- Nasdaq Composite: Trading below its 25-day and 50-day moving averages, the index is showing deteriorating short-term momentum. It nevertheless remains above its 200-day moving average.
- S&P 500: The index has slipped below its 25-day and 50-day moving averages but remains above its 200-day moving average.
- Dow Jones Industrial Average: The index remains above its 25-day and 50-day moving averages and comfortably above its 200-day moving average, according to the supplied technical readings.
- Russell 2000: Despite Thursday’s modest gain, the index remains below its 25-day, 50-day, and 200-day moving averages, indicating persistent technical weakness.
The combination of deteriorating short-term momentum in the Nasdaq and S&P 500, weak NASDAQ breadth, and a high number of new lows suggests that investors should not interpret isolated gains as confirmation of a broader market recovery.
Key Takeaways for Traders and Investors
- Technology remains a major source of market risk. The Nasdaq’s 2.60% decline demonstrates the influence of semiconductor and AI-related stocks on overall market performance. Continued selling in these groups could place further pressure on the S&P 500.
- Strong earnings do not guarantee a rising share price. Western Digital’s results exceeded revenue expectations, yet the stock declined sharply. Traders should assess valuations, forward guidance, and market expectations alongside reported earnings.
- Watch AI capital spending and financing plans. Meta’s potential funding requirements highlight the growing financial commitments associated with AI infrastructure. Investors should focus on whether future revenue and earnings can justify these expenditures.
- Monitor Treasury yields, but do not rely on them alone. A 10-year yield below 5% may be supportive for equities, but technology valuations and corporate spending concerns can outweigh that benefit.
- Market breadth remains a concern. The NYSE’s nearly balanced advance-decline figures and NASDAQ’s negative breadth, combined with the excess of new 52-week lows, suggest that the market lacks consistently broad participation.
- Respect the technical deterioration. The Nasdaq and S&P 500 are below their shorter-term moving averages, while the Russell 2000 remains below all three major averages. Traders should look for sustained price and breadth improvement before assuming that the market has stabilized.
- Maintain disciplined risk management. Geopolitical uncertainty, oil-price movements, earnings announcements, and AI-related capital spending can produce abrupt price swings. Predefined exit levels, appropriate position sizing, and confirmation of trading signals remain important.
Closing Outlook
Thursday’s session highlighted a growing divide between the relative resilience of selected sectors and the pronounced weakness in technology stocks. The Dow Jones Industrial Average managed a marginal gain, but the S&P 500 and Nasdaq Composite declined sharply as investors reassessed AI investment expectations and the risks associated with high-growth valuations.
Western Digital’s earnings reaction and Meta’s disclosures about future financing requirements underscore a central question facing the technology sector: how quickly will the enormous investments in data storage, computing infrastructure, and AI translate into sustainable financial returns?
Meanwhile, weak NASDAQ market breadth and the continued predominance of new 52-week lows indicate that the market’s underlying condition remains fragile. The Dow’s relative strength offers some reassurance, but the technical deterioration in the Nasdaq and S&P 500 warrants continued caution.
For traders and investors, the immediate priorities are to monitor technology-sector stabilization, Treasury yields, upcoming corporate guidance, and improvements in market breadth. Until those signals become more convincing, a selective approach focused on risk management and confirmed price action remains prudent.
.
NOTICE TO READERS
The Canadian Vanguard Stock Market is about empowering you to build and manage your wealth by yourself. There is certainly no magic in managing finances or wealth but one needs to know what to do and commit to doing what is needed. When you are ready to start the journey to Take Charge and Put Your Destiny In Your Own Hands, start with reading The Canadian Vanguard every market day. If and when you need more related information or to advertise your business products or services in The Canadian Vanguard, Contact Us
Our readers are strongly advised to conduct their own research into individual stocks before making a purchase decision. In addition, investors are advised that past stock performance is no guarantee of future price appreciation. Any recommendation is not a guarantee of any particular stock’s future prices, and The Canadian Vanguard accepts no responsibility or liability for investors’ or readers’ purchases.
Stocks In The News/ Stocks To Watch and Market Strategy will soon be available only to Paying Subscribers. The dollar sign “$” in the Toronto Market section in the articles only stands for Canadian dollar and in the US market section “$” stands for US dollar.
(c) This article is published by The Canadian Vanguard on October 22, 2026