







Markets Advance on Strong Earnings and Easing Oil Price Pressures
The Canadian Vanguard Stock Market Report Monday, October 26, 2026, Edition
.
The Toronto Market
Monday’s Toronto Market Index
The S&P/TSX Composite Index advanced 155.98 points, or 0.44%, to close at 35,944.16 on Monday.
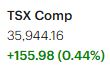

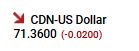
After declining for two consecutive sessions, the index rebounded to finish in positive territory. The TSX now appears poised to reclaim the psychologically significant 36,000 level. However, the timing of that move may depend less on domestic market fundamentals and more on geopolitical developments beyond North America.
Despite Monday’s positive market performance, tensions in the Middle East appear to be escalating once again. Traders and investors should closely monitor geopolitical developments and assess their potential impact on market sentiment and volatility before making trading decisions.
From a technical perspective, the TSX Composite Index is now trading slightly above both its 25-day and 50-day moving averages, while remaining comfortably above its 200-day moving average. This positioning suggests that the broader trend remains constructive, although near-term direction may be influenced by evolving geopolitical risks and the index’s ability to break decisively above the 36,000 level.
Monday’s TSX Market Statistics
Market breadth on the Toronto Stock Exchange (TSX) improved on Monday, with advancing issues comfortably outnumbering declining issues. The exchange recorded 1,476 advancers and 728 decliners, resulting in an advancer-to-decliner ratio of 2.03:1, or approximately two advancing stocks for every declining stock. A further 130 issues closed unchanged.
These figures indicate a broadly positive market session, with participation extending beyond the index’s overall gain. However, external factors, particularly geopolitical developments influencing oil prices and, to some extent, bond yields, continue to affect market sentiment and limit the market’s ability to establish a sustained upward trend. Nevertheless, Monday’s market breadth showed a notable improvement.
New 52-Week Highs and Lows
The TSX recorded 75 new 52-week highs and 72 new 52-week lows on Monday, compared with 54 new highs and 148 new lows on Friday.
Market internals strengthened considerably, as the number of new 52-week highs increased by approximately 39% while the number of new lows declined by approximately 51% from Friday’s levels. The ratio of new highs to new lows improved to 1.04:1 on Monday, compared with 0.36:1 on Friday.
This represents a significant improvement in market internals. Monday was also one of the few recent sessions in which new 52-week highs outnumbered new 52-week lows. Although this is an encouraging development, a single session does not establish a sustained trend. The broader market internals remain fragile, and further confirmation will be needed to determine whether the improvement can be maintained.
Trading Volume and Market Outlook
Total trading volume on the TSX reached 389,800,935 shares on Monday, approximately 3.6% lower than Friday’s volume of 404,502,345 shares.
Despite the improvement in market breadth and the more favourable balance between new highs and lows, investors should continue to exercise caution. The market remains susceptible to volatility, and a consistent directional trend has yet to emerge.
Going forward, investors should closely monitor market internals for evidence of a sustained improvement. A consistent pattern in which new 52-week highs outnumber new 52-week lows would provide stronger confirmation of improving market conditions and reinforce the case for a more durable recovery. Until that pattern becomes established, prudent risk management remains essential.
.
The US Markets
Monday’s U.S. Market Indexes
All four major U.S. stock market indexes advanced on Monday, with the Nasdaq Composite leading the gains. The Dow Jones Industrial Average rose 146.42 points, or 0.28%, to close at 52,361.58. The S&P 500 gained 53.09 points, or 0.70%, finishing at 7,676.77. The Nasdaq Composite advanced 214.04 points, or 0.82%, to close at 26,169.38, while the Russell 2000 added 10.53 points, or 0.38%, to finish at 2,786.42.

Monday’s gains provided a positive reprieve following recent market weakness. The Nasdaq and S&P 500 led the advance, with the Nasdaq gaining nearly 1%, a relatively strong performance. However, the rebound should be viewed with some caution until the indexes demonstrate that they can sustain their recovery.
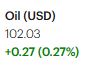
U.S. crude oil prices also moved higher on Monday, a development that can put pressure on equities by raising inflation concerns and complicating the outlook for interest rates. Nevertheless, investors largely looked past the increase in oil prices, allowing all four major indexes to finish in positive territory. The relative strength of the Nasdaq and S&P 500 was particularly notable.
Technical Outlook: Moving Averages
From a technical perspective, the major indexes continue to show mixed signals.
Dow Jones Industrial Average: The Dow remains above its 25-day, 50-day and 200-day moving averages. This is a relatively constructive technical position, suggesting that the index continues to demonstrate strength across the short-, intermediate- and longer-term trends.
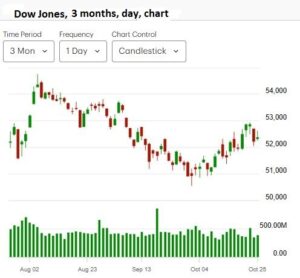
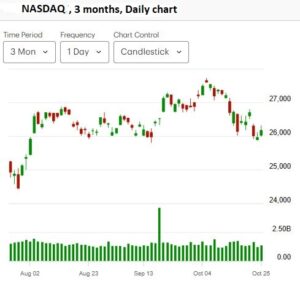
Nasdaq Composite: Despite Monday’s strong advance, the Nasdaq remains below its 25-day and 50-day moving averages while trading comfortably above its 200-day moving average. The recovery is encouraging, but the index needs to regain its intermediate-term moving averages to demonstrate more convincing strength. The 50-day moving average is an important technical reference point, although it should be considered alongside other indicators rather than as an absolute rule. One can see from the chart below that NASDAQ, like most technology stock’s have damaged chart. Technology and especially semiconductor stocks suffered significant losses during the last four weeks.
S&P 500: The S&P 500 is also trading below its 25-day and 50-day moving averages while remaining well above its 200-day moving average. This suggests that near-term and intermediate-term momentum remain under pressure despite Monday’s gains. A sustained move back above the 50-day moving average would provide a more positive technical signal.
Russell 2000: The Russell 2000 remains below its 25-day, 50-day and 200-day moving averages. Of the four major indexes, its technical position is particularly concerning, indicating persistent weakness across multiple time frames. The index will need a more substantial recovery to improve its technical outlook.
Market Outlook
Monday’s broad-based advance was encouraging, particularly given the rise in crude oil prices. However, the underlying technical picture remains uneven. The Dow continues to show relative strength, while the Nasdaq and S&P 500 need to reclaim key moving averages, and the Russell 2000 requires a more significant recovery.
Investors should avoid interpreting a single positive session as confirmation that the recent weakness has ended. Sustained gains, improvements in market breadth and the ability of the indexes to regain important technical levels will be key indicators to watch in the coming sessions. Given continuing sensitivity to oil prices, geopolitical developments and interest-rate expectations, prudent risk management remains important.
Monday’s U.S. Market Statistics
New York Stock Exchange (NYSE)
Market breadth on the New York Stock Exchange (NYSE) was positive on Monday, as advancing issues outnumbered declining issues. The exchange recorded 2,584 advancers, 1,900 decliners and 439 unchanged issues, producing an advancer-to-decliner ratio of 1.36:1. This means there were approximately seven advancing stocks for every five declining stocks.
Despite the positive breadth, the market’s underlying technical condition remains weak, as new 52-week lows continued to substantially outnumber new highs.
The exchange recorded 114 new 52-week highs and 286 new 52-week lows, compared with 110 new highs and 337 new lows on Friday.
Total NYSE trading volume reached 5,900,368,634 shares, approximately 15% higher than Friday’s volume of 5,131,685,939 shares.
Market Internals and Technical Outlook
The NYSE’s market internals remain weak, although Monday’s statistics showed some improvement. The number of new 52-week highs increased by approximately 4% from Friday, while the number of new lows declined by about 15%.
The ratio of new 52-week highs to new 52-week lows improved to approximately 0.40:1, equivalent to two new highs for every five new lows, compared with approximately 0.33:1, or one new high for every three new lows, on Friday.
This improvement is encouraging, but it does not yet indicate a decisive recovery. New 52-week lows remain more than twice as numerous as new highs, suggesting that weakness persists across a substantial number of individual stocks despite the positive market breadth.
A healthier market environment would require a sustained improvement in these indicators, ideally with new 52-week highs consistently exceeding new lows. A series of constructive sessions, punctuated by occasional decisively bullish readings, would provide stronger evidence that market internals are recovering toward the healthier conditions observed several months ago.
For now, investors and traders should remain cautious. They should monitor market breadth, new highs and lows, and trading volume closely, while maintaining appropriate risk controls and clearly defined exit strategies should market conditions deteriorate.
NASDAQ Market Statistics
NASDAQ also recorded positive market breadth on Monday, with advancing stocks outnumbering declining stocks. The exchange reported 2,584 advancers, 2,299 decliners and 403 unchanged issues, resulting in an advancer-to-decliner ratio of approximately 1.12:1. This represents roughly six advancing stocks for every five declining stocks.
Although this is a positive breadth reading, NASDAQ’s underlying market internals remain weak because new 52-week lows continue to substantially outnumber new highs.
The exchange recorded 116 new 52-week highs and 436 new 52-week lows, compared with 95 new highs and 446 new lows on Friday.
Market Internals and Technical Outlook
NASDAQ’s market internals have been under pressure for several weeks, with new 52-week lows consistently outnumbering new highs. Friday continued this pattern, with new lows exceeding new highs by approximately 4.7 to 1.
Monday brought some improvement. The number of new 52-week highs increased by approximately 22% compared with Friday, while the number of new lows declined by about 2%.
The resulting new-high-to-new-low ratio improved to approximately 0.27:1, equivalent to 27 new highs for every 100 new lows. Nevertheless, the imbalance remains substantial, indicating that weakness among individual NASDAQ-listed stocks is still widespread.
The improvement in new highs is a positive development, but a single session cannot establish a sustained recovery. NASDAQ needs a series of constructive trading sessions, supported by improving breadth and a meaningful reduction in new 52-week lows, before investors can have greater confidence in the durability of the market’s performance.
The recovery in NASDAQ’s market internals may take time. Investors should therefore distinguish between a strong daily gain in the index and a broader improvement in the underlying condition of its constituent stocks.
Trading Volume and Index Performance
NASDAQ trading volume reached 7,663,318,625 shares on Monday, approximately 13% higher than Friday’s volume of 6,786,597,536 shares.
Combined with the Nasdaq Composite Index’s 0.82% advance on Monday, the increase in trading volume is an encouraging sign. It suggests that the index’s positive performance was accompanied by greater trading activity.
However, higher volume and a strong index gain do not, by themselves, confirm that the market’s underlying weakness has ended. The persistently high number of new 52-week lows remains a concern.
NASDAQ needs to deliver more sessions resembling Monday’s performance, preferably accompanied by stronger market breadth and improving new-high-to-new-low ratios. We should continue to monitor these indicators closely to determine whether a sustained recovery is developing.
Key Takeaways for Traders and Investors
- Market breadth was positive on both exchanges. Advancing stocks outnumbered declining stocks on the NYSE and NASDAQ, indicating that Monday’s gains had reasonably broad participation by this measure.
- Underlying market internals remain weak. New 52-week lows continued to exceed new highs on both exchanges. This divergence between positive daily breadth and weak longer-term internal indicators warrants caution.
- The NYSE showed encouraging improvement. New 52-week lows declined by approximately 15%, and the ratio of new highs to new lows improved from Friday’s reading. Further progress is needed to confirm a sustained recovery.
- NASDAQ’s recovery requires confirmation. The Nasdaq Composite rose 0.82% on higher trading volume, while new 52-week highs increased. However, the large number of new lows suggests that many individual stocks remain under pressure.
- Watch for a sustained improvement in market internals. A consistent increase in new highs relative to new lows, supported by healthy market breadth, would provide stronger evidence of a durable recovery than an isolated positive session.
- Maintain disciplined risk management. Given the market’s fragile underlying condition, traders and investors should avoid becoming overly confident after a single strong session. Position sizing, stop-loss discipline where appropriate, and predefined exit strategies remain important.
Overall Market Assessment
Monday’s U.S. market statistics presented a mixed but cautiously encouraging picture. Both the NYSE and NASDAQ recorded positive market breadth, trading volume increased on both exchanges, and the number of new 52-week lows declined.
However, new 52-week lows continued to outnumber new highs substantially on both exchanges. This suggests that the market’s recovery remains incomplete and that weakness persists beneath the surface.
The priority in the coming sessions will be to determine whether Monday’s improvement develops into a sustained trend. Consistently stronger breadth, rising numbers of new 52-week highs and declining numbers of new lows would provide more convincing evidence that market conditions are improving.
Until that happens, caution remains warranted. Traders and investors should continue monitoring market internals closely and remain prepared to adjust their positions if the market’s direction changes.
.
NOTICE TO READERS
The Canadian Vanguard Stock Market is about empowering you to build and manage your wealth by yourself. There is certainly no magic in managing finances or wealth but one needs to know what to do and commit to doing what is needed. When you are ready to start the journey to Take Charge and Put Your Destiny In Your Own Hands, start with reading The Canadian Vanguard every market day. If and when you need more related information or to advertise your business products or services in The Canadian Vanguard, Contact Us
Our readers are strongly advised to conduct their own research into individual stocks before making a purchase decision. In addition, investors are advised that past stock performance is no guarantee of future price appreciation. Any recommendation is not a guarantee of any particular stock’s future prices, and The Canadian Vanguard accepts no responsibility or liability for investors’ or readers’ purchases.
The dollar sign “$” in the Toronto Market section in the articles only stands for Canadian dollar and in the US market section “$” stands for US dollar.
(c) This article is published by The Canadian Vanguard on October 26, 2026