







Markets Retreat as Surging Oil Prices and Renewed Middle East Tensions Rattle Investors
The Canadian Vanguard Stock Market Report Weekend, October 23-25, 2026, Edition
.
The Toronto Market
Friday’s Toronto Market Index
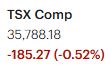
The S&P/TSX Composite Index fell 185.27 points (-0.52%) on Friday to close at 35,788.18, extending its decline to a second consecutive session.
The index moved further below the psychologically significant 36,000 level as renewed geopolitical concerns once again weighed on North American markets. Overall, Friday’s trading session was decidedly negative, with escalating tensions in the Middle East appearing to dampen investor sentiment.
From a technical perspective, the TSX declined for a second straight session and is now trading around its 25-day and 50-day moving averages, which have converged. This area could serve as an important near-term support zone. However, the index remains comfortably above its 200-day moving average, suggesting that the broader longer-term trend remains relatively resilient.

Friday’s TSX Market Statistics
Market breadth on the Toronto Stock Exchange (TSX) was decidedly negative on Friday, with declining issues significantly outnumbering advancing issues. There were 1,545 decliners and 659 advancers, resulting in a decliner-to-advancer ratio of 2.34:1, or approximately 12 decliners for every five advancers. An additional 131 issues closed unchanged. These figures reflect broad-based selling pressure across the market.
External factors, particularly renewed geopolitical tensions, continue to weigh on investor sentiment. Concerns surrounding the Middle East are influencing oil prices and, to some extent, bond yields, contributing to continued market uncertainty. The TSX struggled to establish positive momentum, and overall market breadth remained firmly negative.
Market internals weakened further on Friday. The exchange recorded 54 new 52-week highs and 148 new 52-week lows, compared with 89 new highs and 132 new lows on Thursday. This represents a decline of approximately 39% in new highs and an increase of about 12% in new lows. The ratio of new 52-week highs to new lows deteriorated to approximately 0.36:1, or roughly one new high for every three new lows, compared with 0.67:1 on Thursday. This deterioration indicates that underlying market conditions remain weak, with more stocks experiencing significant declines than demonstrating strength.
Trading activity also slowed considerably. Total TSX share volume reached 404,502,345 shares, approximately 21% below Thursday’s volume of 510,504,922 shares. The lower trading volume suggests reduced market participation, although it does not, by itself, establish the strength or conviction behind the decline.
Market Outlook and Investment Strategy
The combination of negative market breadth, deteriorating 52-week highs and lows, and continued geopolitical uncertainty suggests that investors should remain cautious. The market has struggled to establish a consistent direction, alternating between advances and declines without demonstrating sustained positive momentum.
Under these conditions, investors may wish to review their portfolio allocations, maintain appropriate liquidity, and avoid taking excessive risks until market conditions become clearer. Holding a higher cash allocation can provide flexibility during periods of heightened volatility and preserve capital for potential opportunities when market conditions improve.
Ultimately, capital preservation and disciplined risk management should remain priorities. Investors should monitor market breadth, technical support levels, trading volume, and geopolitical developments for signs of stabilization or a more sustained recovery before committing additional capital.
.
Friday’s Toronto Stock Market (TSX) Wrap-Up Report
Market Overview: TSX Extends Its Decline
The Toronto Stock Exchange (TSX) came under renewed selling pressure on Friday, with the S&P/TSX Composite Index falling 185.27 points (-0.52%) to close at 35,788.18. The index declined for a second consecutive session, moving further below the psychologically important 36,000 level as geopolitical tensions in the Middle East and concerns about their impact on oil prices and broader financial markets weighed on investor sentiment.
The session was broadly negative, with Energy the only sector to finish in positive territory. Market breadth also deteriorated, confirming that selling pressure extended well beyond a handful of large-cap stocks.
The index is now trading around its converging 25-day and 50-day moving averages, an area that traders may wish to monitor for signs of near-term support or further weakness. However, the TSX remains comfortably above its 200-day moving average, suggesting that its longer-term technical picture has not yet deteriorated to the same extent as its short-term momentum.
In the overnight market, gold prices advanced as oil prices eased. This development may offer some relief to investors concerned about inflationary pressures and geopolitical risk. Nevertheless, overnight price movements do not necessarily predict the direction of the next regular trading session, and traders should wait for confirmation from market prices before adjusting their positions.
Sector Performance: Energy Stands Alone
Friday’s sector performance highlighted the defensive and commodity-sensitive nature of the Canadian market. Energy was the only sector to advance, while the remaining sectors finished lower.
- Energy: +1.46% — the strongest sector, benefiting from the prevailing oil-market environment.
- Technology: -0.11% — relatively resilient compared with the broader market.
- Utilities: -0.30% — posted a modest decline.
- Financials: -0.96% — came under renewed pressure.
- Basic Materials: -1.07% — extended its weakness.
- Telecommunications Services: -1.84% — experienced a notable decline.
- Durable Consumer Goods & Services: -2.51% — the weakest sector of the session.
The fact that Energy was the only advancing sector points to a narrow and uneven market rally within an otherwise negative session. For traders, this reinforces the importance of examining individual sector strength rather than assuming that gains in one area signal a broader market recovery.
Weekly Sector Performance
Despite Friday’s weakness, weekly performance was mixed, with several sectors retaining gains while others experienced substantial losses.
- Industrials: +1.90% — the strongest sector for the week.
- Healthcare: +1.67% — ranked second.
- Technology: +0.97%.
- Financials: +0.77%.
- Durable Consumer Goods & Services: -1.73%.
- Basic Materials: -8.00% — the weakest sector by a considerable margin.
The sharp weekly decline in Basic Materials is particularly noteworthy. Combined with the sector’s further loss on Friday, it points to persistent weakness in this area of the Canadian market. Traders interested in resource-related stocks should distinguish between companies benefiting from stronger commodity prices and those exposed to weaker underlying commodity trends.
Canadian Big Six Banks: Another Weak Session
All six of Canada’s major banks finished lower on Friday, extending the sector’s weakness from Thursday. The declines were relatively broad-based, suggesting that selling pressure was not confined to a single institution.
- Royal Bank of Canada (RY): -0.36% — the strongest performer among the six banks.
- Toronto-Dominion Bank (TD): -0.38%.
- Bank of Nova Scotia (BNS): -0.55%.
- Bank of Montreal (BMO): -0.77%.
- Canadian Imperial Bank of Commerce (CM): -0.88%.
- National Bank of Canada (NA): -1.13% — the weakest performer among the group.
The weakness across all six banks contributed to the negative performance of the Financials sector. Since Canadian banks are important constituents of the TSX Composite Index, their continued decline is worth monitoring when assessing the broader market’s ability to stabilize.
For traders, a potential improvement in the banks could help support an index recovery. However, a single positive session would not necessarily signal a sustained reversal; confirmation through broader sector participation and improving market breadth would be more convincing.
Company News and Stocks to Watch
🔒 Premium Content
You must be a subscriber to access the remaining parts of this section. Current subscription rate is $60 CAD for a year
Login or Subscribe
Technical Outlook: The 36,000 Level Remains in Focus
The S&P/TSX Composite Index closed at 35,788.18, below the psychologically important 36,000 threshold. Its second consecutive daily decline has brought the index to the area of its converging 25-day and 50-day moving averages.
This technical area may become important in the near term:
- Potential support: Traders can monitor the 25-day and 50-day moving averages for evidence that buyers are stepping in. A sustained break below this area could indicate additional short-term weakness.
- The 36,000 level: The index’s ability to recover this level may help gauge whether buying interest is returning. A move back above it would be more constructive if accompanied by improving market breadth.
- The 200-day moving average: The index remains comfortably above its longer-term average, which provides a more constructive longer-term reference point than the current short-term price action alone would suggest.
These are monitoring levels rather than guaranteed support or resistance. The actual moving-average values, price action, and trading volume should be checked before making decisions based on technical signals.
Key Takeaways for Traders and Investors
🔒 Premium Content
You must be a subscriber to access the remaining parts of this section. Current subscription rate is $60 CAD for a year
Login or Subscribe
.
The US Markets
Friday’s US Market Indexes
Dow Leads the Decline as Oil Prices Weigh on Stocks
Market Overview: Major Indexes Finish Lower
All four major US stock indexes finished lower on Friday, with the Dow Jones Industrial Average leading the decline as surging oil prices and renewed geopolitical concerns weighed on investor sentiment.
The Dow Jones Industrial Average fell 652.82 points (-1.23%) to close at 52,215.16, making it the worst performer among the major indexes.
The S&P 500 declined 39.75 points (-0.52%) to finish at 7,623.68, while the Nasdaq Composite slipped 53.52 points (-0.21%) to close at 25,955.34. The Russell 2000 fell 8.13 points (-0.29%) to end the session at 2,775.90.

Although technology stocks and small-cap stocks outperformed the broader market on a relative basis, neither group managed to finish in positive territory. The Nasdaq and Russell 2000 recorded the smallest percentage declines among the four indexes, suggesting comparatively greater resilience in these segments during Friday’s sell-off.
The latest declines reflect continued uncertainty surrounding geopolitical developments and the impact of higher oil prices on inflation expectations, bond yields, and corporate costs. Investors remain sensitive to the possibility that elevated energy prices could complicate the outlook for inflation and monetary policy.
Market Rotation: Technology Shows Relative Resilience
Friday’s performance offered some evidence of a possible rotation away from the market’s largest blue-chip stocks, although one session is not enough to establish a sustained trend.
The Dow’s 1.23% decline was considerably steeper than the Nasdaq’s 0.21% loss. The Russell 2000 also outperformed the Dow, declining by just 0.29%.
The Nasdaq showed some improvement during the session but ultimately failed to close in positive territory. Its relatively modest decline suggests that technology stocks were more resilient than many traditional blue-chip constituents on Friday.
For traders, this divergence is worth monitoring. If technology and smaller-cap stocks continue to outperform while the Dow remains under pressure, it could signal a shift in relative market leadership. However, confirmation over several sessions would be needed before treating this as an established rotation.
Technical Outlook: Indexes Show Mixed Levels of Weakness
The four major indexes are displaying different technical conditions relative to their key moving averages. These differences may help traders assess which segments of the US market are holding up best during the current pullback.
Dow Jones Industrial Average
The Dow declined sharply on Friday but remains above its 25-day, 50-day, and 200-day moving averages.
This is a notable distinction from the other indexes, as the Dow’s short-term price weakness has not yet pushed it below these key technical reference points. Nevertheless, Friday’s substantial loss warrants attention. Continued selling could test the resilience of the current uptrend, while stabilization above the moving averages would be a more constructive development.
Nasdaq Composite
The Nasdaq is trading clearly below its 25-day and 50-day moving averages but remains comfortably above its 200-day moving average.
This configuration points to weakening short-term momentum, even though the longer-term trend remains comparatively resilient. Traders may wish to monitor whether the index can recover its shorter-term moving averages or whether additional selling develops.
S&P 500
The S&P 500 is now below both its 25-day and 50-day moving averages, indicating that short-term technical conditions have weakened.
However, the index remains comfortably above its 200-day moving average. This suggests that the current pullback has not yet translated into a comparable deterioration in its longer-term technical position.
A recovery above the shorter-term moving averages would improve the near-term picture, while continued weakness would warrant closer monitoring of potential support levels.
Russell 2000
The Russell 2000 remains below its 25-day and 50-day moving averages and is also trading slightly below its 200-day moving average.
Of the four indexes, this is the most concerning longer-term technical configuration. Small-cap stocks can be sensitive to financing costs, economic growth expectations, and changes in investor risk appetite. The index’s position relative to all three moving averages suggests that traders should exercise caution when assessing the prospects for a sustained small-cap recovery.
A move back above the 200-day moving average, followed by a recovery in the shorter-term averages, would provide more encouraging technical evidence.
.
Key Takeaways for Traders and Investors
1. Maintain a cautious short-term outlook.
All four major indexes declined on Friday, and higher oil prices remain a potential source of volatility. Traders should avoid assuming that a single session of relative resilience signals an immediate market recovery.
2. Monitor the divergence between the Dow and Nasdaq.
The Dow’s substantially larger decline compared with the Nasdaq suggests that selling pressure was uneven across the market. If this divergence persists, it may provide clues about changing sector leadership and investor preferences.
3. Pay close attention to the moving averages.
The Nasdaq and S&P 500 are below their 25-day and 50-day moving averages, while the Russell 2000 is also slightly below its 200-day average. These levels are important technical reference points, but traders should seek confirmation from subsequent price action rather than treating them as guaranteed support or resistance.
4. Watch oil prices and geopolitical developments.
A sustained rise in oil prices could increase inflation concerns and affect bond yields, potentially weighing on equities. Conversely, easing energy prices could reduce some of these pressures, although the market’s reaction will depend on the broader economic and geopolitical backdrop.
5. Prioritize risk management.
In a volatile market, traders may wish to review position sizes, portfolio concentration, and stop-loss plans. Investors with longer time horizons should distinguish between short-term price weakness and a more substantial deterioration in the underlying market trend.
Final Assessment
Friday’s session highlighted growing pressure on US equities, with the Dow Jones Industrial Average suffering the largest decline. The Nasdaq and Russell 2000 demonstrated relative resilience, but neither managed to advance.
Technically, the market remains divided. The Dow continues to trade above all three of its key moving averages, while the Nasdaq and S&P 500 have weakened below their shorter-term averages. The Russell 2000 remains the most technically vulnerable, trading below its 25-day, 50-day, and 200-day moving averages.
For the coming sessions, traders should watch whether the major indexes can stabilize, whether technology stocks continue to outperform, and whether easing or rising oil prices alter the market’s direction. Until broader market strength becomes more evident, a selective and disciplined approach to risk management remains appropriate.
Friday’s US Market Statistics
NYSE and NASDAQ Market Internals Remain Weak
New York Stock Exchange (NYSE): Negative Breadth and Deteriorating Market Internals
Market breadth on the New York Stock Exchange (NYSE) was firmly negative on Friday, with declining issues significantly outnumbering advancing issues. The exchange recorded 2,868 decliners and 1,667 advancers, while 542 issues closed unchanged. This produced a decliner-to-advancer ratio of approximately 1.72:1, meaning there were about eight declining stocks for every five advancing stocks.
The negative breadth indicates that selling pressure remained widespread across NYSE-listed stocks, providing little evidence of broad-based market support.
52-Week Highs and Lows
The NYSE recorded 110 new 52-week highs and 337 new 52-week lows, compared with 173 new highs and 366 new lows on Thursday.
The number of new 52-week highs decreased by approximately 36%, while new lows declined by about 8%. Although fewer stocks reached new lows, the reduction in new highs was considerably sharper. Consequently, the ratio of new highs to new lows weakened from approximately 0.47 on Thursday to 0.33 on Friday.
In practical terms, Friday produced approximately one new 52-week high for every three new 52-week lows. This remains a weak reading and suggests that stocks experiencing significant downside pressure continue to outnumber those demonstrating strong upside momentum.
The decline in new lows is a potentially encouraging development, but it is not sufficient on its own to confirm a market recovery. A more convincing improvement would involve a sustained increase in new highs, a further reduction in new lows, and stronger overall market breadth.
Trading Volume
Total NYSE trading volume reached approximately 5.13 billion shares, down about 15% from Thursday’s 6.07 billion shares.
The lower volume indicates reduced trading activity during Friday’s session. However, declining volume alone does not establish whether selling pressure is easing or whether investors are becoming less engaged with the market.
NYSE Assessment
The NYSE’s internal indicators remain weak. Decliners substantially outnumbered advancers, and new 52-week lows continued to exceed new highs by approximately three to one.
Although the number of new lows decreased from Thursday, the broader market has yet to demonstrate sufficient improvement to support a confident bullish outlook. Traders should remain selective, monitor individual positions closely, and avoid interpreting a modest improvement in one indicator as confirmation of a sustained recovery.
NASDAQ: Negative Breadth Persists Despite a Modest Improvement in New-High/New-Low Ratio
NASDAQ market breadth was also negative on Friday. The exchange recorded 2,991 declining issues and 1,880 advancing issues, with another 179 issues closing unchanged. This produced a decliner-to-advancer ratio of approximately 1.59:1, or roughly eight decliners for every five advancers.
Although the Nasdaq Composite was relatively resilient compared with the Dow Jones Industrial Average, the underlying market statistics show that selling pressure remained widespread across NASDAQ-listed stocks.
52-Week Highs and Lows
NASDAQ recorded 95 new 52-week highs and 446 new 52-week lows, compared with 114 new highs and 559 new lows on Thursday.
The number of new highs declined by approximately 17%, while new lows decreased by about 20%. Despite the reduction in both measures, new lows continued to outnumber new highs by approximately 4.7 to one.
The ratio of new highs to new lows improved from approximately 0.20 on Thursday to 0.21 on Friday. This represents a modest improvement in the balance between stocks reaching new highs and those falling to new lows, but the overall reading remains weak.
Put another way, Friday produced only about 21 new 52-week highs for every 100 new 52-week lows. The continued dominance of new lows indicates that underlying weakness remains widespread, even though the ratio improved slightly.
The improvement should therefore be viewed as a small positive development rather than a confirmed reversal in market conditions. Further progress would require the ratio to rise consistently, supported by stronger breadth and a sustained reduction in new lows.
Trading Volume
Total NASDAQ trading volume on Friday was approximately 6.79 billion shares, compared with 9.36 billion shares on Thursday. This represents a decline of about 27%.
The substantial reduction in volume indicates that trading activity slowed considerably. However, without additional information about the composition of the trading and the price action throughout the session, lower volume alone cannot confirm that selling pressure has reached exhaustion.
NASDAQ Assessment
NASDAQ’s market internals remain weak despite the modest improvement in the new-high/new-low ratio.
Declining stocks continued to outnumber advancing stocks, and new 52-week lows remained nearly five times as numerous as new highs. These readings suggest that the relatively better performance of the Nasdaq Composite Index does not yet reflect a broad-based recovery among its constituents.
Traders should continue monitoring the relationship between the index’s price performance and its underlying breadth. A sustained recovery would be more convincing if the number of advancing stocks increased and the balance between new highs and new lows improved over several sessions.
Key Takeaways for Traders and Investors
1. Market breadth remains negative on both exchanges.
Decliners outnumbered advancers on both the NYSE and NASDAQ. This indicates that weakness was broad-based rather than confined to a small number of individual stocks.
2. New 52-week lows remain a significant warning signal.
The NYSE recorded roughly three new lows for every new high, while NASDAQ recorded nearly five new lows for every new high. These ratios suggest that many individual stocks remain under pressure even when headline indexes show relative resilience.
3. NASDAQ showed a small improvement, but confirmation is needed.
The new-high/new-low ratio improved slightly from Thursday to Friday. However, the change was modest, and the absolute number of new lows remains elevated relative to new highs. Traders should look for continued improvement before drawing stronger bullish conclusions.
4. Lower trading volume is not automatically bullish.
Both exchanges experienced a substantial decline in volume. While reduced activity may accompany a pause in selling, it does not independently establish that the market has found a bottom.
5. Prioritize risk management and position discipline.
In an unstable market, traders should review position sizes, portfolio concentration, stop-loss plans, and exposure to particularly weak stocks or sectors. Investors may also wish to maintain sufficient liquidity to preserve flexibility as conditions evolve.
6. Look for confirmation across multiple indicators.
A more constructive market signal would involve improving advance-decline ratios, rising new-high/new-low ratios, fewer new lows, and sustained price strength in the major indexes. Improvement across several indicators would provide stronger evidence of stabilization than a single positive reading.
Final Assessment
Friday’s market statistics indicate that US equity market internals remain weak. Both the NYSE and NASDAQ recorded negative breadth, while new 52-week lows continued to exceed new highs substantially.
NASDAQ showed a modest improvement in its new-high/new-low ratio, and both exchanges recorded fewer new lows than on Thursday. These are encouraging developments at the margin, but they are not yet sufficient to establish a sustained recovery.
For traders and investors, the priority should remain capital preservation, disciplined risk management, and close monitoring of market breadth. Until the underlying indicators improve more consistently, caution is warranted when initiating new positions or increasing exposure to equities.
Friday’s US Stock Market Wrap-Up Report
Rising Oil Prices, Geopolitical Risks, and Broad Market Weakness Keep Investors Cautious
Market Overview: Dow Leads a Broad-Based Sell-Off
Wall Street finished lower on Friday as surging oil prices and renewed geopolitical concerns weighed on investor sentiment. The Dow Jones Industrial Average was the worst performer among the major indexes, while the Nasdaq Composite and Russell 2000 demonstrated relative resilience but still ended the session in negative territory.
The Dow fell 652.82 points (-1.23%) to close at 52,215.16. The S&P 500 declined 39.75 points (-0.52%) to 7,623.68, while the Nasdaq Composite slipped 53.52 points (-0.21%) to 25,955.34. The Russell 2000 dropped 8.13 points (-0.29%) to finish at 2,775.90.
Friday’s session marked a second consecutive daily decline for the S&P 500, Nasdaq Composite, and Russell 2000, while the Dow’s latest decline followed a different short-term pattern.
The main market driver was the sharp increase in oil prices amid renewed geopolitical concerns surrounding the Middle East. Reports suggesting that the conflict involving Iran could resume or intensify after the US midterm elections in early November added to investor uncertainty. Such reports should be treated as potential scenarios rather than confirmed future developments.
Higher energy prices can complicate the inflation outlook, put pressure on bond yields, and raise operating costs for businesses. These concerns may help explain why investors remained reluctant to take on additional equity risk.
Oil Prices and Treasury Yields: A Challenging Combination
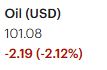
Oil prices surged on Friday, with West Texas Intermediate (WTI) crude futures rising nearly 4% to approximately US$103.30 per barrel, according to the figures supplied.
At the same time, the US 10-year Treasury yield reportedly increased by five basis points to approximately 5%, although it remained below its recent highs.
The combination of rising oil prices and elevated Treasury yields presents a difficult backdrop for equities. Higher energy prices can reinforce inflation concerns, while higher Treasury yields can increase borrowing costs and make fixed-income investments more competitive with stocks.
This environment is particularly challenging for companies whose valuations depend heavily on expectations of future earnings growth. It can also pressure consumer-facing businesses if households face higher fuel and other living costs.
For traders, the relationship between crude oil, Treasury yields, and equity prices deserves close attention. A sustained decline in oil prices and stabilization in yields could ease some of the pressure on stocks. Conversely, further increases in both could create additional headwinds.
🔒 Premium Content
You must be a subscriber to access the remaining parts of this section. Current subscription rate is $60 CAD for a year
Login or Subscribe
The four major US indexes are showing different technical conditions.
Dow Jones Industrial Average: The Dow remains above its 25-day, 50-day, and 200-day moving averages despite Friday’s sharp decline. Its technical structure is comparatively resilient, but continued selling could put that resilience to the test.
S&P 500: The index is below its 25-day and 50-day moving averages but remains comfortably above its 200-day moving average. This suggests weakening short-term momentum without a comparable breakdown in its longer-term trend.
Nasdaq Composite: The Nasdaq is also below its 25-day and 50-day moving averages while remaining above its 200-day moving average. Semiconductor weakness and the index’s position below its shorter-term averages warrant close monitoring.
Russell 2000: The small-cap index remains below its 25-day, 50-day, and 200-day moving averages. This is the weakest technical configuration among the four indexes and suggests that small-cap stocks remain particularly vulnerable.
These moving averages should be treated as reference points rather than guaranteed support or resistance. Traders should monitor actual price levels, volume, and subsequent market breadth before drawing conclusions about a possible reversal.
Market Internals: Selling Pressure Remains Widespread
Friday’s market statistics confirmed that the weakness extended beyond the headline indexes.
On the New York Stock Exchange (NYSE), declining issues totalled 2,868 compared with 1,667 advancing issues, producing a decliner-to-advancer ratio of approximately 1.72:1. The exchange recorded 110 new 52-week highs and 337 new lows, a ratio of approximately one new high for every three new lows.
NASDAQ also experienced negative breadth, with 2,991 declining issues and 1,880 advancing issues. It recorded 95 new 52-week highs and 446 new lows, meaning new lows outnumbered new highs by approximately 4.7 to one.
There were some marginally encouraging developments. The number of new lows declined on both exchanges compared with Thursday, and NASDAQ’s new-high/new-low ratio improved slightly. Nevertheless, the overall readings remain weak.
Trading volume also declined substantially on both exchanges, falling approximately 15% on the NYSE and 27% on NASDAQ based on the reported figures. Lower volume does not, by itself, establish that selling pressure is exhausted or that a market bottom has formed.
The combination of negative breadth and elevated new-low readings suggests that a sustainable recovery would require broader participation, not simply gains in a small number of heavily weighted stocks.
Key Takeaways for Traders and Investors
1. Treat the market as vulnerable until breadth improves.
All four major indexes declined, while both the NYSE and NASDAQ recorded more declining stocks than advancing stocks. A sustained improvement in advance-decline ratios and new-high/new-low readings would provide more convincing evidence of stabilization.
2. Monitor crude oil and Treasury yields together.
Oil near US$103.30 per barrel and a 10-year Treasury yield near 5%, based on the supplied figures, represent an important combination to watch. Further increases could intensify inflation concerns and pressure equity valuations, while easing prices and yields could provide relief.
3. Distinguish semiconductor weakness from broader technology performance.
Technology gained 0.18% on Friday even as semiconductor stocks reportedly faced selling pressure. Traders should monitor individual stocks and industry-specific trends rather than treating the entire sector as a single trade.
4. Focus on relative strength, not just daily gains.
Healthcare led weekly sector performance, while Energy benefited from rising oil prices. SentinelOne also outperformed on Friday. These names and sectors may merit further research, but sustained relative strength and appropriate risk-reward conditions should be confirmed before entering positions.
5. Pay attention to the Russell 2000’s technical weakness.
The Russell 2000 remains below all three of its key moving averages. A recovery above these levels would be a constructive development, while continued weakness would reinforce the need for caution toward small-cap exposure.
6. Manage risk and preserve flexibility.
Traders may wish to review position sizes, concentration, stop-loss levels, and exposure to volatile stocks. Investors may also consider whether their current cash allocation appropriately reflects their risk tolerance and investment horizon.
Final Assessment
Friday’s US market session was characterized by rising oil prices, geopolitical uncertainty, widespread negative market breadth, and uneven sector performance. The Dow led the decline, while the Nasdaq and Russell 2000 were relatively resilient but still finished lower.
Energy was the strongest sector, while Healthcare led weekly performance. Technology’s small Friday gain also suggests that semiconductor weakness should not automatically be interpreted as a broad-based technology sell-off.
Nevertheless, market internals remain weak, the S&P 500 and Nasdaq are below their shorter-term moving averages, and the Russell 2000 remains below all three of its key averages. These conditions argue for a selective, disciplined approach rather than aggressive buying.
For the coming sessions, the most important signals to watch are the direction of oil prices and Treasury yields, the behaviour of semiconductor stocks, the ability of the major indexes to stabilize, and whether market breadth begins to improve consistently.
The central message for traders and investors is straightforward: preserve capital, monitor relative strength, and wait for broader confirmation before treating a short-term rebound as a sustainable market recovery.
.
NOTICE TO READERS
The Canadian Vanguard Stock Market is about empowering you to build and manage your wealth by yourself. There is certainly no magic in managing finances or wealth but one needs to know what to do and commit to doing what is needed. When you are ready to start the journey to Take Charge and Put Your Destiny In Your Own Hands, start with reading The Canadian Vanguard every market day. If and when you need more related information or to advertise your business products or services in The Canadian Vanguard, Contact Us
Our readers are strongly advised to conduct their own research into individual stocks before making a purchase decision. In addition, investors are advised that past stock performance is no guarantee of future price appreciation. Any recommendation is not a guarantee of any particular stock’s future prices, and The Canadian Vanguard accepts no responsibility or liability for investors’ or readers’ purchases.
The dollar sign “$” in the Toronto Market section in the articles only stands for Canadian dollar and in the US market section “$” stands for US dollar.
(c) This article is published by The Canadian Vanguard on October 24, 2026