







Market Rally as Oil Prices Slide and Treasury Yields Retreat Ahead of U.S. Midterm Elections
The Canadian Vanguard Stock Market Report Tuesday, November 3, 2026, Edition
.
The Toronto Market
Tuesday’s Toronto Market Index
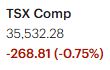
The S&P/TSX Composite Index slumped 268.81 points, or 0.75%, to close at 35,532.28.
U.S. Midterm Election Uncertainty Weighs on the TSX
The TSX declined today amid uncertainty surrounding the U.S. midterm elections. Financial markets around the world were largely dominated by one major issue: the U.S. elections and their potential implications for the global economy and financial markets.
The TSX opened sharply lower, deep in negative territory, and remained under pressure throughout the session, eventually closing near its opening level.
The index appears to be in no hurry to reclaim the psychologically important 36,000 level. The outcome of the U.S. midterm elections could prove to be a significant turning point for market direction in the days ahead.
In the meantime, traders and investors should exercise caution and prioritize capital preservation. Maintaining a reduced market exposure of approximately 50% to 70% of portfolio value may be a prudent defensive approach while uncertainty remains elevated. The objective is to protect capital, manage risk, and maintain sufficient flexibility to respond to changing market conditions once the political uncertainty begins to settle.
Technical Outlook
The TSX Composite Index closed today’s session with a downward gap, falling below both its 25-day and 50-day moving averages. However, the index continues to trade comfortably above its 200-day moving average, suggesting that its longer-term technical position remains relatively stronger than its short-term outlook.
For now, investors should remain defensive and closely monitor the market’s reaction to developments in the United States.
Tuesday’s TSX Market Statistics
Market Breadth Remains Negative
At the TSX, declining issues (decliners) outnumbered advancing issues (advancers). Specifically, there were 1,230 decliners compared to 973 advancers, resulting in a decliner-to-advancer ratio of approximately 1.26 to 1. This translates to roughly five decliners for every four advancers. An additional 146 issues remained unchanged.
Overall, the TSX market session was negative. Market breadth remained weak and deteriorated further, reflecting continued selling pressure across the exchange. The market’s internal indicators also remain weakened, suggesting that underlying market conditions have yet to show meaningful improvement.
New 52-Week Highs and Lows
The exchange recorded 8 new 52-week highs and 26 new 52-week lows, compared with 12 new highs and 49 new lows recorded yesterday.
Compared with the previous session:
- New 52-week highs decreased by approximately 33%.
- New 52-week lows decreased by approximately 47%.
Although the number of both new highs and new lows declined, new lows continued to outnumber new highs significantly. The ratio of new 52-week highs to new 52-week lows was approximately 3:10 today, compared with roughly 1:4 yesterday.
This indicates that the market’s internal strength remains weak. While the decline in the number of new 52-week lows is encouraging, it is not yet sufficient to signal a meaningful improvement in market conditions.
Trading Volume and Market Volatility
Total trading volume on the TSX reached 405,610,000 shares, approximately 15% lower than yesterday’s volume of 475,906,000 shares.
Volatility remains a significant factor in the current market environment, and investors should not expect it to disappear anytime soon. We must continue monitoring the market’s internal data closely to identify any emerging trends or potential changes in market direction.
In particular, a sustained improvement in market breadth and the relationship between new 52-week highs and new 52-week lows will be essential in determining whether the current weakness is beginning to reverse.
For the market’s internal indicators to strengthen meaningfully, we need to see a consistent shift in which new 52-week highs outnumber new 52-week lows. Until that happens, the underlying market trend should be treated with caution.
.
Tuesday’s Toronto TSX Market Wrap-Up Report
A Difficult Session for the TSX as Market Uncertainty Weighs on Investor Sentiment
The Toronto Stock Exchange experienced another disappointing trading session on Tuesday, with the S&P/TSX Composite Index declining 268.81 points, or 0.75%, to close at 35,532.28.
Investor sentiment remained cautious as financial markets around the world focused on uncertainty surrounding the U.S. midterm elections. The TSX opened sharply lower and remained under pressure throughout the session, eventually closing near its opening level.
The index continues to struggle to regain the psychologically important 36,000 level. Its inability to reclaim this level, combined with weakening market internals, suggests that investors remain reluctant to commit significant new capital to equities.
Sector Performance: A Mixed Picture Beneath the Surface
Despite the broader market decline, sector performance was mixed, with some industries posting impressive gains while others experienced substantial selling pressure.
Technology Services led the reported sector gainers, advancing 11.14%, followed by Retail Trade, which gained 10.02%. Utilities rose 6.88%, while Energy Minerals advanced 4.04%. Consumer Durables gained 3.02%, Financials added 3.26%, and Transportation increased 2.04%.
On the downside, Distribution Services declined 6.33%, Health Services fell 0.74%, while Electronic Technology was the weakest reported sector, plunging 19.83%.
The wide divergence in sector performance highlights the importance of selective stock picking in the current market environment. While certain sectors and individual companies continue to attract buying interest, the broader market remains vulnerable to volatility and selling pressure.
Canadian Big Six Banks: Broad-Based Weakness
All six of Canada’s major banks finished lower on Tuesday, reflecting the cautious tone prevailing across the financial markets.
Toronto-Dominion Bank (TD) was the best performer among the major banks, declining just 0.14% to close at $174.75.
Canadian Imperial Bank of Commerce (CM) slipped 0.15% to finish at $163.36.
Bank of Montreal (BMO) was the weakest performer among the banks, falling 0.61% to close at $240.56, with approximately 5.5 million shares traded.
The weakness across Canada’s major banks is worth monitoring, particularly given the importance of the financial sector to the overall performance of the TSX Composite Index.
Energy Stocks: Oil Price Weakness Weighs on the Sector
Most oil stocks finished lower as crude oil prices declined. Investors appeared cautious about taking additional positions in energy stocks while diplomatic efforts to resolve the conflict in the Middle East continued.
The absence of stronger support from crude oil prices weighed on energy-related equities, reinforcing the importance of monitoring oil price movements when assessing the near-term outlook for Canadian energy stocks.
Individual Stock Highlights and Company News
Corporate earnings announcements and company-specific developments continued to influence individual stock performance, producing some significant price movements.
Shopify Inc. (TSX: SHOP)
Shopify was among the notable decliners, tumbling 8.02% to close at $200.19, with approximately 3.4 million shares traded.
The Canadian e-commerce company’s third-quarter revenue and gross merchandise volume reportedly fell short of Wall Street expectations, disappointing investors and triggering significant selling pressure.
The sharp decline illustrates how quickly sentiment can change when a high-growth company fails to meet market expectations. Traders should watch whether Shopify attracts renewed buying interest or experiences further technical weakness following the earnings disappointment.
Agnico Eagle Mines Limited (TSX: AEM)
Agnico Eagle Mines advanced 0.92% to close at $238.41, with approximately 711,000 shares traded.
The stock demonstrated relative resilience during an otherwise difficult trading session. Its performance is worth monitoring as investors continue to assess opportunities in the gold-mining sector.
Precision Drilling Corporation (TSX: PD)
Precision Drilling declined to close at $136.76, with approximately 214,800 shares traded.
Energy-related stocks remain sensitive to movements in crude oil prices, making the direction of the underlying commodity market an important consideration for traders following this stock.
5N Plus Inc. (TSX: VNP)
5N Plus is a smaller-cap company worth adding to the watchlist of investors looking for opportunities beyond Canada’s larger, more established companies.
The stock declined 0.32% on Tuesday to close at $26.10, with approximately 366,800 shares traded.
Despite Tuesday’s modest decline, the company has attracted attention following a strong earnings report. The specialty chemicals and engineered materials manufacturer reported impressive results, with its share price having gained approximately 24.74% in the associated earnings-driven move.
Investors may want to monitor VNP for signs of continued institutional interest, sustained trading volume, and the stock’s ability to consolidate its recent gains.
Bombardier Inc. (TSX: BBD.B)
Bombardier advanced 4.02% to close at $340.16, with approximately 214,000 shares traded.
The company announced that it had signed a memorandum of understanding with UK-based BAE Systems to explore potential collaboration on next-generation combat air programs.
The proposed collaboration covers several areas, including research and development, systems integration, supply chain development, industrialization, and lifecycle management.
The two companies intend to establish a framework for identifying areas of cooperation and evaluating potential business opportunities.
The announcement represents a potentially interesting development for Bombardier as it explores opportunities connected to advanced aerospace and defence programs.
TSX Market Internals: Underlying Market Weakness Persists
Beyond the headline index decline, the TSX’s internal market statistics provided additional evidence of underlying weakness.
Declining issues outnumbered advancing issues, with 1,230 decliners against 973 advancers and 146 unchanged issues. This produced a decliner-to-advancer ratio of approximately 1.26 to 1.
The exchange recorded 8 new 52-week highs and 26 new 52-week lows. Although the number of new lows declined significantly from the previous session’s 49, new lows continued to outnumber new highs by a substantial margin.
The ratio of new 52-week highs to new 52-week lows was approximately 3 to 10, compared with approximately 1 to 4 in the previous session.
While the reduction in new 52-week lows is a modestly encouraging development, the overall picture remains weak. A sustained improvement in the number of new highs relative to new lows will be necessary before we can conclude that market internals are strengthening.
Total TSX trading volume reached approximately 405.6 million shares, down about 15% from the previous session’s 475.9 million shares.
The combination of negative market breadth, more new lows than new highs, and continued weakness in the index’s short-term technical position suggests that investors should remain cautious.
Technical Outlook: TSX Remains Below Key Short-Term Moving Averages
From a technical perspective, the S&P/TSX Composite Index closed at 35,532.28, having moved below both its 25-day and 50-day moving averages.
However, the index continues to trade comfortably above its 200-day moving average.
This distinction is important. The deterioration in the short-term technical picture indicates that selling pressure remains a concern, but the index has not yet lost its longer-term moving-average support.
The inability to regain the 36,000 level also suggests that the market may require a significant improvement in investor sentiment before another sustained advance can develop.
The U.S. midterm elections represent an important near-term event that traders and investors should monitor closely.
Key Takeaways for Traders and Investors
Tuesday’s trading session reinforces the need for caution, disciplined portfolio management, and close monitoring of the market’s internal indicators.
1. Protect Capital and Manage Market Exposure
With the TSX trading below its 25-day and 50-day moving averages and market breadth remaining negative, capital preservation should remain a priority.
Investors may wish to consider maintaining market exposure in the range of 50% to 70% of portfolio value, depending on their individual risk tolerance, investment objectives, and time horizon.
2. Do Not Confuse Individual Stock Strength with Broad Market Strength
Some sectors and individual stocks are still producing impressive gains. However, the broader market statistics indicate that participation remains weak.
Traders should be selective and avoid assuming that strength in a handful of stocks represents a broader market recovery.
3. Watch the New 52-Week Highs and Lows
The relationship between new 52-week highs and new 52-week lows remains one of the most important indicators to monitor.
A sustained increase in new highs accompanied by a consistent decline in new lows would provide more convincing evidence that market internals are improving.
Until that happens, investors should remain cautious about interpreting short-term market rallies as the beginning of a sustainable recovery.
4. Monitor the 36,000 Level and Key Moving Averages
The 36,000 level remains an important psychological reference point for the TSX.
Traders should also monitor the index’s ability to regain its 25-day and 50-day moving averages. A sustained recovery above these levels would improve the short-term technical picture.
5. Be Selective with Earnings-Driven Opportunities
Stocks such as 5N Plus and Bombardier demonstrate that individual company developments can create opportunities even when the broader market is struggling.
However, traders should carefully evaluate earnings quality, trading volume, valuation, and price action before committing capital, particularly after substantial share-price movements.
6. Remain Alert to Political and Geopolitical Developments
The U.S. midterm elections and developments in the Middle East remain important sources of uncertainty.
Investors should be prepared for sudden changes in market sentiment and avoid taking excessive positions ahead of potentially market-moving developments.
Final Market Assessment
The TSX remains under pressure, and Tuesday’s market statistics provide little evidence of a decisive improvement in underlying market conditions.
Although the index remains above its 200-day moving average, its position below the shorter-term moving averages, combined with negative market breadth and a greater number of new 52-week lows than new highs, calls for continued caution.
For traders and investors, this is a time to emphasize capital preservation, exercise patience, and remain selective when identifying new investment opportunities.
The objective is not necessarily to avoid the market altogether, but rather to protect capital, manage risk, and maintain sufficient flexibility to take advantage of opportunities when market conditions eventually improve.
For now, protecting capital should take precedence over aggressively pursuing market returns.
.
The US Markets
Tuesday’s U.S. Market Indexes
U.S. Markets Deliver a Mixed Performance as Volatility Persists
The major U.S. stock market indexes finished Tuesday’s trading session mixed, reflecting continued uncertainty and a lack of consistent buying conviction across the broader market.
The Dow Jones Industrial Average declined 197.26 points, or 0.38%, to close at 51,786.72.
The S&P 500 advanced 27.52 points, or 0.36%, finishing at 7,568.92.
The Nasdaq Composite gained 207.65 points, or 0.83%, to close at 25,372.01.
The Russell 2000 declined 5.97 points, or 0.21%, ending the session at 2,812.45.
The contrasting performances across the major indexes highlight the uneven nature of the current market environment.

Market Performance and Investor Sentiment
Volatility continues to be a persistent feature of the current market, making it increasingly difficult for traders and investors to establish confidence in the sustainability of market advances.
Despite opening higher, three of the four major indexes reportedly experienced early gains during the first half-hour of trading before losing momentum as the session progressed. This intraday reversal suggests that investors remain cautious and that selling pressure continues to emerge when prices move higher.
The broader market’s inability to sustain early gains does not bode particularly well for a healthy investing environment. It suggests that buying conviction remains inconsistent and that investors are still reluctant to commit aggressively to equities.
Another notable development was the reversal in the relative performance of large-cap stocks. Large-cap companies were among Monday’s strongest performers, but that leadership weakened on Tuesday. The Nasdaq Composite posted the strongest percentage gain among the four indexes, while the Dow Jones Industrial Average and Russell 2000 finished lower.
The divergence between the major indexes reinforces the importance of monitoring market leadership rather than relying exclusively on the performance of the S&P 500.
Technical Outlook: Major Indexes Continue to Face Resistance
The technical picture across the major U.S. indexes remains mixed but generally cautious. Most of the indexes continue to trade below their key short-term moving averages, indicating that the recent weakness has not yet been fully reversed.
Dow Jones Industrial Average: The Dow Jones declined 197.26 points to close at 51,786.72. The index is now trading slightly below both its 25-day and 50-day moving averages.
However, it continues to hold above its 200-day moving average, suggesting that its longer-term technical position remains relatively stronger than its short-term outlook.
The ability of the Dow to regain its shorter-term moving averages will be important in determining whether the current weakness is temporary or part of a more sustained correction.
Nasdaq Composite: The Nasdaq Composite advanced 0.83% to close at 25,372.01, making it the strongest performer among the four major indexes on Tuesday.
Despite this gain, the index remains clearly below both its 25-day and 50-day moving averages, although it continues to trade comfortably above its 200-day moving average.
Tuesday’s advance is encouraging, but a single positive session is not sufficient to establish that the Nasdaq has regained its upward momentum. Investors should look for sustained buying interest and a recovery above the shorter-term moving averages before becoming more optimistic.
S&P 500: The S&P 500 gained 0.36% to close at 7,568.92.
Despite Tuesday’s advance, the index remains below both its 25-day and 50-day moving averages. It continues to maintain a considerable gap above its 200-day moving average.
This suggests that the index’s short-term technical condition remains weakened, even though its longer-term trend has not yet experienced the same degree of deterioration.
The ability of the S&P 500 to reclaim its 25-day and 50-day moving averages will be an important development to watch.
Russell 2000: The Russell 2000 declined 0.21% to close at 2,812.45.
Of particular concern is the index’s position below all three of its key moving averages: the 25-day, 50-day, and 200-day.
This represents the weakest technical position among the four major indexes discussed in this report.
The continued weakness in small-cap stocks suggests that investors remain cautious about taking on additional market risk. A sustained recovery above the 200-day moving average would be an important development in improving the Russell 2000’s technical outlook.
Key Takeaways for Traders and Investors
Tuesday’s trading session provides several important observations for market participants.
1. Market Volatility Remains Elevated
The inability of most indexes to sustain early-session gains suggests that market sentiment remains fragile. Traders should be prepared for continued price fluctuations and avoid assuming that an early market advance will necessarily carry through to the closing bell.
2. The Short-Term Technical Picture Remains Weak
Three of the four major indexes remain below both their 25-day and 50-day moving averages. The Russell 2000 is in an even weaker position, trading below all three of its key moving averages.
This technical configuration calls for caution when establishing new positions.
3. Small-Cap Stocks Remain Particularly Vulnerable
The Russell 2000’s position below its 25-day, 50-day, and 200-day moving averages is a warning sign. Traders should monitor whether small-cap stocks begin to recover or whether further weakness develops.
4. Do Not Mistake a Single Positive Session for a Market Reversal
Although the Nasdaq and S&P 500 advanced on Tuesday, both indexes remain below their shorter-term moving averages.
Investors should look for consecutive sessions of improving price action and stronger buying participation before concluding that a sustainable recovery is underway.
5. Capital Preservation Should Remain a Priority
Given the persistent volatility and weakened short-term technical conditions, traders and investors should emphasize risk management, maintain appropriate cash reserves, and avoid excessive portfolio exposure.
Final Market Assessment
Tuesday’s U.S. market performance offered little evidence of a convincing improvement in the broader technical picture.
Although the Nasdaq and S&P 500 managed to finish higher, their positions below their 25-day and 50-day moving averages suggest that the short-term market trend remains under pressure.
The Dow is also showing signs of short-term weakness, while the Russell 2000 continues to display the most concerning technical condition.
For now, the U.S. stock market remains a challenging environment for traders and investors. Patience, selectivity, and capital preservation should take precedence over aggressive buying.
The market needs to demonstrate sustained buying conviction and reclaim its key short-term moving averages before we can confidently conclude that conditions are improving.
Tuesday’s U.S. Market Statistics
NYSE: Market Internals Deteriorate Further
The New York Stock Exchange (NYSE) experienced another weak trading session on Tuesday, with declining issues significantly outnumbering advancing issues.
Specifically, there were 1,685 declining issues compared with 1,027 advancing issues, while 83 issues remained unchanged. This produced a decliner-to-advancer ratio of approximately 1.64 to 1, meaning that roughly five stocks advanced for every eight stocks that declined.
The negative market breadth indicates that selling pressure was widespread across the exchange.
New 52-Week Highs and Lows
The NYSE recorded 38 new 52-week highs and 128 new 52-week lows, compared with 81 new highs and 96 new lows recorded on Monday.
The changes in these indicators are particularly concerning:
- New 52-week highs decreased by approximately 53% compared with Monday.
- New 52-week lows increased by approximately 33%.
The ratio of new 52-week highs to new 52-week lows deteriorated to approximately 3:10, or 0.30, compared with approximately 0.84 on Monday.
This represents a significant deterioration in the exchange’s underlying market strength. The improvement observed on Monday did not continue into Tuesday. Instead, the market’s internal indicators weakened considerably.
The combination of declining market breadth, fewer new 52-week highs, and an increase in new 52-week lows reinforces the conclusion that the NYSE remains in a weak technical condition.
NYSE Trading Volume
Total trading volume on the NYSE reached approximately 5.59 billion shares, about 4% lower than Monday’s volume of approximately 5.81 billion shares.
Although trading volume declined modestly, the more important concern remains the deterioration in market breadth and the relationship between new 52-week highs and new 52-week lows.
NYSE Market Assessment
The NYSE’s internal indicators weakened further on Tuesday, providing little encouragement for investors looking for signs of a sustainable market recovery.
This remains a weak market environment requiring considerable caution.
Traders and investors should continue to exercise discipline, manage their exposure carefully, and establish appropriate risk-management measures before entering new positions. They should also be prepared to reduce or exit positions when market conditions deteriorate or when their predetermined risk limits are reached.
Until the market’s internal indicators demonstrate sustained improvement, capital preservation should remain a priority.
NASDAQ: Positive Market Breadth but Underlying Internals Remain Weak
The NASDAQ presented a somewhat different picture on Tuesday. Unlike the NYSE, advancing stocks outnumbered declining stocks, producing positive market breadth.
There were 2,596 advancing issues compared with 2,282 declining issues, while 206 issues remained unchanged.
This resulted in approximately six advancers for every five decliners. The advancer-to-decliner ratio was approximately 1.14 to 1, indicating that more stocks participated in the advance than in the decline.
This was a positive development for NASDAQ’s daily market breadth.
However, the broader market internals continued to present a considerably less encouraging picture.
New 52-Week Highs and Lows
The NASDAQ recorded 81 new 52-week highs and 311 new 52-week lows, compared with 148 new highs and 421 new lows recorded on Monday.
The changes were as follows:
- New 52-week highs decreased by approximately 45%.
- New 52-week lows decreased by approximately 26%.
Although the number of new 52-week lows declined, the number of new highs also decreased substantially.
The ratio of new 52-week highs to new 52-week lows fell to approximately 26%, compared with approximately 35% on Monday.
This is an important distinction. While fewer stocks were making new lows, the reduction in new highs was proportionately greater. Consequently, the relationship between new highs and new lows deteriorated.
The NASDAQ’s market internals therefore remain weak, despite Tuesday’s positive advancing-versus-declining statistics.
NASDAQ Trading Volume
Total NASDAQ trading volume reached approximately 8.77 billion shares, about 8% lower than Monday’s volume of approximately 9.53 billion shares.
The NASDAQ Composite advanced on Tuesday, but the lower trading volume suggests that the advance occurred with less participation than the previous session.
This does not necessarily invalidate the market’s advance, but it does mean that the improvement should be viewed with some caution.
Ideally, we would like to see the NASDAQ continue advancing with stronger trading participation, improving market breadth, and a sustained improvement in its new-high/new-low indicators.
NASDAQ Market Assessment
The NASDAQ delivered a mixed performance on Tuesday.
On the positive side, advancing issues outnumbered declining issues, indicating that daily market breadth improved relative to the NYSE.
However, the new-high/new-low relationship deteriorated, with the ratio declining from approximately 35% to 26%. Trading volume also decreased by approximately 8%.
These developments suggest that the NASDAQ’s underlying market strength remains insufficient to establish confidence in a sustained recovery.
Although there are some encouraging signs, we need to see a consistent sequence of positive trading sessions, accompanied by improving market internals, before concluding that the market is developing a healthier and more sustainable upward trend.
We will continue monitoring the NASDAQ closely and report any meaningful changes in its internal indicators that could signal the beginning of a new market trend.
Key Takeaways for Traders and Investors
Tuesday’s market statistics provide an important reminder that the performance of the major market indexes does not always reflect the underlying condition of the broader stock market.
1. NYSE Internals Remain Particularly Weak
The NYSE experienced deterioration across several important indicators. Declining stocks substantially outnumbered advancing stocks, while new 52-week lows increased and new highs decreased.
This is not the kind of market environment that encourages aggressive buying.
2. NASDAQ’s Positive Breadth Should Not Be Misinterpreted
Although NASDAQ recorded more advancing stocks than declining stocks, its new-high/new-low ratio deteriorated.
One positive breadth reading does not necessarily indicate that the broader market is recovering.
3. Watch the New 52-Week Highs and Lows
These indicators remain particularly important in assessing the underlying health of the market.
We want to see new 52-week highs consistently increasing relative to new 52-week lows. A sustained reversal in this relationship would provide more convincing evidence of improving market conditions.
4. Exercise Caution When Establishing New Positions
Traders should remain selective when initiating new positions, use appropriate stop-loss or other risk-management strategies, and avoid excessive exposure.
Investors should also consider whether their current portfolio exposure is appropriate for the prevailing market conditions.
5. Look for Consecutive Sessions of Improvement
One or two positive trading sessions are not enough to establish a new upward market trend.
We need several consecutive sessions of improving breadth, stronger new-high/new-low readings, and more convincing trading participation before becoming substantially more optimistic.
Final Market Assessment
The NYSE and NASDAQ presented two different pictures on Tuesday, but neither exchange provided convincing evidence of a broad-based improvement in underlying market conditions.
The NYSE’s internal indicators deteriorated further, while NASDAQ demonstrated positive daily market breadth but continued weakness in its new-high/new-low relationship.
The message for traders and investors remains straightforward: This is a market that requires patience, selectivity, disciplined risk management, and a strong emphasis on capital preservation.
We should not rush to increase market exposure simply because one or more major indexes finish a session higher.
The priority should be to monitor the market’s internal indicators carefully and wait for sustained evidence that market strength is returning before becoming more aggressive.
For now, protecting capital remains more important than chasing market returns.
.
Tuesday’s U.S. Market Wrap-Up Report
U.S. Stock Market Delivers a Mixed Performance as Sector Rotation and Earnings Drive Individual Stock Movements
The U.S. stock market delivered a mixed performance on Tuesday, with the major indexes finishing in different directions as investors continued to assess corporate earnings, economic developments, and uncertainty surrounding the U.S. midterm elections.
The Dow Jones Industrial Average declined 197.26 points, or 0.38%, to close at 51,786.72. The S&P 500 advanced 27.52 points, or 0.36%, to finish at 7,568.92, while the Nasdaq Composite gained 207.65 points, or 0.83%, closing at 25,372.01. The Russell 2000 slipped 5.97 points, or 0.21%, to finish at 2,812.45.
Although the Nasdaq and S&P 500 managed to post gains, the overall trading environment remained challenging. Market volatility continues to be a major concern, and investors are still struggling to establish confidence in the sustainability of the current market advances.
Earnings season is in full swing, providing opportunities for significant individual stock movements. At the same time, the U.S. midterm elections remain an important consideration for investors as they assess the potential implications for financial markets and the broader economy.
Sector Performance: Strong Gains in Several Industry Groups
Tuesday’s sector performance revealed considerable strength across several industry groups, despite the mixed performance of the major market indexes.
Commercial Services led the reported sector gainers, advancing 13.75%. Consumer Non-Durables followed with an impressive gain of 11.22%. Health Technology advanced 9.24%, while Consumer Services gained 8.57%.
Utilities rose 8.49%, Consumer Durables advanced 7.26%, Energy Minerals gained 6.36%, and Finance increased 5.02%. Distribution Services also finished higher, advancing 3.66%.
The strength in these industry groups suggests that buying interest was not restricted exclusively to traditional technology stocks. Several non-technology areas also attracted considerable investor attention.
Health Technology and Consumer Non-Durables are particularly interesting because their strength could indicate opportunities for investors looking to diversify away from heavily concentrated technology and artificial intelligence positions.
However, traders should distinguish between strong individual sector performances and the broader market’s underlying condition. The market’s internal statistics continued to indicate weakness, despite the impressive gains recorded in several industry groups.
Treasury Yields and Crude Oil: Important Developments for Investors
The U.S. 10-year Treasury yield declined by nearly six basis points to approximately 4.95%.
The decline in Treasury yields is an important development for equity investors because changes in bond yields can influence stock valuations, borrowing costs, and investor preferences between fixed-income securities and equities.
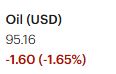
Meanwhile, U.S. crude oil futures declined modestly to $96.09 per barrel, marking their lowest settlement level since October 14, according to the cited Dow Jones Market Data report.
The weakness in crude oil prices is worth monitoring, particularly for energy investors. Lower oil prices can place pressure on energy producers, although the impact varies considerably depending on individual companies’ production costs, financial positions, and operating strategies.
Individual Stock Highlights: Cloud Computing, AI Infrastructure and Technology Lead Several Notable Advances
Tuesday produced several impressive individual stock performances, particularly among companies associated with cloud computing, artificial intelligence infrastructure, data centers, and advanced technology.
🔒 Premium Content
You must be a subscriber to access the remaining parts of this section. Current subscription rate is $60 CAD for a year
Login or Subscribe
Kiniksa Pharmaceuticals (KNSA)
Kiniksa Pharmaceuticals advanced 2.74% to close at $93.29, with approximately 1 million shares traded.
The stock’s positive performance adds to the list of healthcare-related companies attracting investor attention.
Moderna Inc. (MRNA)
Moderna gained 3.45% to close at $228.44, with approximately 9.5 million shares traded.
The advance is notable because pharmaceutical and biotechnology companies may offer investors opportunities to diversify their portfolios beyond the technology and AI sectors.
Sector Rotation: Could Health Technology Offer Opportunities Beyond AI?
One interesting development on Tuesday was the strength demonstrated by several non-traditional technology industry groups, particularly Health Technology, Consumer Non-Durables, Utilities, and Consumer Services.
Investors who have become increasingly concerned about excessive concentration in artificial intelligence and high-growth technology stocks may want to broaden their research into other industry groups.
Health Technology is one area worth monitoring. Companies in pharmaceuticals, biotechnology, medical devices, and healthcare innovation can offer exposure to different business and earnings drivers from those influencing the AI infrastructure industry.
However, sector rotation should be confirmed by sustained relative strength rather than interpreted from a single trading session.
Mastercard (MA), for example, performed reasonably well on Monday but declined on Tuesday. This illustrates that investors rotating away from technology and AI stocks should remain selective rather than assuming that all non-technology stocks will automatically outperform.
U.S. Market Internals: A Warning Beneath the Surface
Despite Tuesday’s gains in the S&P 500 and Nasdaq Composite, the underlying market statistics provided reasons for continued caution.
New York Stock Exchange (NYSE): The NYSE experienced negative market breadth, with 1,685 declining issues compared with 1,027 advancing issues and 83 unchanged issues.
The decliner-to-advancer ratio was approximately 1.64 to 1, meaning that eight stocks declined for every five that advanced.
The exchange recorded 38 new 52-week highs and 128 new 52-week lows, compared with 81 new highs and 96 new lows on Monday.
This represents a significant deterioration in market internals. New highs declined by approximately 53%, while new lows increased by approximately 33%.
The new-high-to-new-low ratio deteriorated to approximately 30%, compared with 84% on Monday.
Total NYSE trading volume reached approximately 5.59 billion shares, about 4% lower than Monday’s volume.
The overall message from the NYSE statistics is concerning: market breadth weakened, fewer stocks reached new highs, and more stocks established new lows.
NASDAQ: The NASDAQ presented a somewhat more encouraging picture in terms of daily market breadth.
Advancing issues numbered 2,596 compared with 2,282 declining issues, while 206 issues remained unchanged.
This produced positive market breadth, with approximately six advancers for every five decliners.
However, the new-high/new-low statistics continued to reveal underlying weakness.
The NASDAQ recorded 81 new 52-week highs and 311 new 52-week lows, compared with 148 new highs and 421 new lows on Monday.
New highs decreased by approximately 45%, while new lows declined by approximately 26%.
Consequently, the new-high-to-new-low ratio deteriorated to approximately 26%, compared with approximately 35% on Monday.
Total NASDAQ trading volume reached approximately 8.77 billion shares, about 8% lower than Monday’s volume.
Although the Nasdaq Composite advanced 0.83%, the lower trading volume and deteriorating new-high/new-low relationship suggest that the advance did not receive convincing confirmation from the broader market internals.
Taken together, the NYSE and NASDAQ statistics indicate that the broader U.S. equity market remains vulnerable, even as selected stocks and industry groups continue to produce impressive gains.
Technical Outlook: Major Indexes Remain Below Important Short-Term Moving Averages
The technical condition of the major U.S. indexes remains an important concern for traders and investors.
The Dow Jones Industrial Average is now slightly below its 25-day and 50-day moving averages, although it continues to trade above its 200-day moving average.
The Nasdaq Composite remains below both its 25-day and 50-day moving averages but continues to maintain a comfortable gap above its 200-day moving average.
The S&P 500 also remains below its 25-day and 50-day moving averages while trading above its 200-day moving average.
The Russell 2000 presents the weakest technical picture among the four indexes, remaining below its 25-day, 50-day, and 200-day moving averages.
The combination of weakening short-term technical conditions and deteriorating market internals suggests that investors should not become overly optimistic simply because the Nasdaq and S&P 500 finished higher on Tuesday.
A sustained recovery above the shorter-term moving averages, supported by improving market breadth and stronger internal indicators, would provide more convincing evidence of a meaningful improvement.
🔒 Premium Content
You must be a subscriber to access the remaining parts of this section. Current subscription rate is $60 CAD for a year
Login or Subscribe
Final Market Assessment
Tuesday’s U.S. stock market session was characterized by impressive individual stock advances, mixed index performance, and continued weakness in the underlying market internals.
The Nasdaq and S&P 500 finished higher, but the NYSE’s negative market breadth and deterioration in the new-high/new-low relationship indicate that the broader market has not yet established a convincing foundation for a sustainable recovery.
The strength in AI infrastructure stocks was encouraging, while the performance of Health Technology and other non-technology industry groups suggests that opportunities for sector diversification continue to develop.
However, traders and investors should remain mindful that strong individual stock performances do not necessarily translate into a healthy overall market.
For now, the appropriate approach is to remain selective, protect capital, monitor market internals, and wait for stronger confirmation before increasing market exposure.
The bottom line: There are still individual stocks offering attractive trading opportunities, but the broader market has not yet demonstrated the strength necessary to justify an aggressive investment posture. Capital preservation should remain the priority.
.
NOTICE TO READERS
The Canadian Vanguard Stock Market is about empowering you to build and manage your wealth by yourself. There is certainly no magic in managing finances or wealth but one needs to know what to do and commit to doing what is needed. When you are ready to start the journey to Take Charge and Put Your Destiny In Your Own Hands, start with reading The Canadian Vanguard every market day. If and when you need more related information or to advertise your business products or services in The Canadian Vanguard, Contact Us
Our readers are strongly advised to conduct their own research into individual stocks before making a purchase decision. In addition, investors are advised that past stock performance is no guarantee of future price appreciation. Any recommendation is not a guarantee of any particular stock’s future prices, and The Canadian Vanguard accepts no responsibility or liability for investors’ or readers’ purchases.
The dollar sign “$” in the Toronto Market section in the articles only stands for Canadian dollar and in the US market section “$” stands for US dollar.
(c) This article is published by The Canadian Vanguard on November 3, 2026