






Relentless Selling Sends U.S. Markets Plunging as Major Indexes Approach Correction Territory
The Canadian Vanguard Stock Market Report – Weekend November 20-22, 2026 Edition
.
The Toronto Market
Friday’s Toronto Market Index
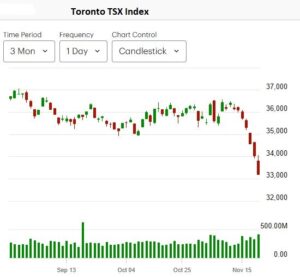
The S&P/TSX Composite Index declined 838.88 points, or 2.47%, to close at 33,189.85.
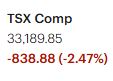
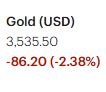
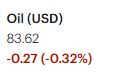
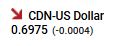
As of Friday’s close, the market has recorded six consecutive sessions of declines. Although AI-related developments and concerns have generally had an impact on financial markets, the TSX Composite Index has relatively few high-profile technology stocks. Consequently, while the Toronto market is not entirely immune to the negative effects of U.S. market reactions to AI-related concerns, the impact has generally been less significant and less pronounced than in the U.S. markets. The Canadian market is more heavily weighted toward the financial, energy, and precious metals sectors.
Market breadth was negative again today, marking the fourth consecutive session of negative breadth. This continued deterioration suggests that selling pressure remains widespread and that market conditions warrant caution.
Traders and investors should continue to prioritize capital preservation by maintaining adequate risk-management measures, guidelines, and trading discipline. One consideration is to limit market exposure to approximately 10%–15% of portfolio value for the time being. This would help reduce potential losses while allowing investors to remain patient as they await confirmation of a sustainable market turnaround.
Technically, the TSX Composite Index closed below its 21-day, 50-day, and 200-day moving averages. The index has deteriorated considerably over the past several weeks, reflecting a weakening technical picture. The level of risk facing traders and investors has also increased, particularly following the index’s move below its 50-day moving average.
Until the market demonstrates meaningful signs of stabilization and establishes a confirmed turnaround, a cautious and defensive investment approach remains appropriate.
Friday’s TSX Market Statistics
At the Toronto Stock Exchange (TSX), declining issues (decliners) significantly outnumbered advancing issues (advancers). Specifically, there were 2,004 decliners and 500 advancers, resulting in a decliner-to-advancer ratio of 4.08 to 1. In other words, approximately four stocks declined for every stock that advanced. An additional 217 issues closed unchanged. Overall, market breadth was decidedly negative.
The exchange recorded 21 new 52-week highs and 497 new 52-week lows today, compared with 16 new 52-week highs and 307 new 52-week lows yesterday.
The number of new 52-week highs increased by approximately 31% compared with yesterday. More significantly, the number of new 52-week lows increased by approximately 62%, representing a ratio of 1.62 to 1, compared with yesterday’s figure. This indicates a substantial deterioration in the number of stocks reaching new lows. The number of stocks recording new 52-week highs remained considerably lower than the number recording new lows on both days.
Overall, these figures point to increasingly weak market internals, with selling pressure continuing to broaden and market conditions deteriorating from one trading session to the next.
Total trading volume on the TSX reached 856,613,425 shares today, representing an increase of approximately 44.6% from yesterday’s volume of 592,265,069 shares. The combination of substantially higher trading volume and overwhelmingly negative market breadth warrants particular attention.
Investors and traders should continue to monitor the market’s internal statistics closely. These indicators can provide valuable early clues about changes in market direction and help investors recognize developing opportunities or risks and respond accordingly.
Finally, readers are reminded of the importance of waiting for convincing confirmation of a market turnaround and the establishment of a sustainable uptrend before committing to major positions or undertaking significant trades. Preserving capital and maintaining appropriate risk-management discipline should remain the primary considerations under current market conditions.
Friday’s Toronto Stock Exchange (TSX) Market Wrap-Up Report
A Market Under Increasing Selling Pressure
The Toronto Stock Exchange (TSX) suffered another significant setback on Friday, extending its losing streak to six consecutive trading sessions, according to the earlier market index report. The market’s deterioration has become increasingly concerning, with selling pressure continuing to spread across a broad range of stocks and sectors.
Although the Canadian market is less dominated by technology stocks than its U.S. counterparts, Friday’s market weakness demonstrated that the ongoing sell-off is not simply a technology-sector problem. Selling pressure has become much broader, affecting multiple areas of the market, including financial, energy, materials, and technology-related stocks.
There were, however, a few pockets of relative strength.
Communications led the TSX sectors for the second consecutive session, gaining 14.88%. Utilities followed with an advance of 7.08%, while Commercial Services rose 5.80%, Transportation gained 2.58%, and Retail Trade advanced 1.24%.
On the other hand, Energy Minerals, Non-Energy Minerals, and Electronic Technology were among the weakest-performing sectors, declining 15.31%, 21.42%, and 22.79%, respectively.
The sharp divergence between the stronger and weaker sectors suggests that investors are becoming increasingly selective and that capital is moving away from some of the more vulnerable areas of the market. Nevertheless, the strength displayed by a handful of sectors should not be mistaken for evidence of a broad market recovery.
Individual Stock Performances and Company Developments
Stocks Under Significant Selling Pressure
Several prominent TSX-listed companies experienced substantial declines on Friday.
Shopify Inc. (SHOP) fell 6.47% to close at $177.09, with approximately 2.4 million shares traded. Trading volume exceeded its 50-day average daily volume, suggesting unusually heavy trading activity amid the market weakness. The elevated volume, together with the sharp price decline, points to significant selling pressure.
Celestica Inc. (CLS) dropped 16.38% to close at C$288.00, while HUT declined 17.37% to finish at $65.88. Neither stock reached a new 52-week low on Friday, but their substantial losses highlight the extent of the selling pressure affecting individual companies.
These declines also demonstrate why traders should pay close attention to individual stock price action, trading volume, and support levels rather than relying exclusively on broad market index movements.
Relative Strength in Communications and Utilities
While most of the market struggled, some investors appeared to favour relatively defensive areas of the market, particularly Utilities and Communications.
Utilities was the second-best-performing sector on Friday, providing a notable contrast to the broader market weakness.
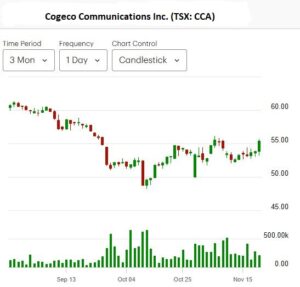
Telus Corporation (T) advanced 2.32% to close at $15.86, with approximately 22.4 million shares traded. Cogeco Communications Inc. (CCA) gained 3.01% to close at $55.40, with approximately 215,800 shares traded.
Other notable outperformers included:
- Quebecor Inc. Class A (QBR.A) advanced 4.40% to close at $61.70, with approximately 18,300 shares traded.
- Tenaz Energy Corp. (TNZ) gained 7.08% to close at $43.26, with approximately 722,600 shares traded.
- Boyd Group Services Inc. (BYD) advanced 4.41% to close at $105.81, with approximately 233,600 shares traded.
These stocks demonstrated relative strength against the broader market. However, traders should distinguish between individual stock resilience and a genuine improvement in overall market conditions. A stock can outperform during a market decline without necessarily establishing a sustainable uptrend.
Molson Coors Announces Quarterly Dividends
Molson Coors Canada Inc. Class A (TPX.A) advanced 5.26% on Friday to close at $60.00, with approximately 300,000 shares traded.
In a related corporate announcement, the Board of Directors of Molson Coors Beverage Company (NYSE: TAP and TAP.A) declared a regular quarterly dividend of US$0.48 per share on its Class A and Class B common stock.
The dividend is payable on December 18, 2026, to shareholders of record as of December 4, 2026.
Similarly, the Board of Directors of Molson Coors Canada Inc. (TSX: TPX.A and TPX.B) declared a quarterly dividend of approximately C$0.68 per share, representing the Canadian-dollar equivalent of the dividend declared by Molson Coors Beverage Company.
The Canadian dividend is also payable on December 18, 2026, to eligible Class A and Class B exchangeable shareholders of record as of December 4, 2026. These dividends qualify as eligible dividends for Canadian income tax purposes.
The dividend announcement provides additional corporate context for the stock’s performance, although traders should avoid assuming that the announcement alone explains Friday’s price appreciation.
Market Internals Continue to Signal Deteriorating Conditions
Beyond the individual stock and sector performances, the TSX’s underlying market statistics provide further evidence of the deteriorating market environment.
Declining issues outnumbered advancing issues by approximately 4.08 to 1, with 2,004 decliners compared with only 500 advancers. Another 217 issues closed unchanged.
This represents decidedly negative market breadth, indicating that selling pressure was widespread rather than concentrated in just a few heavily weighted stocks.
The exchange also recorded 21 new 52-week highs against 497 new 52-week lows. This compares with 16 new highs and 307 new lows in the previous session.
The increase in new 52-week lows is particularly concerning. The number of stocks establishing new lows increased by approximately 62% from the previous session, while the number of new highs increased by approximately 31%.
The substantial imbalance between new highs and new lows suggests that an increasing number of TSX-listed companies are experiencing significant technical deterioration.
Total trading volume reached approximately 856.6 million shares, compared with 592.3 million shares in the previous session, representing an increase of approximately 44.6%.
The combination of substantially higher trading volume, overwhelmingly negative market breadth, and a growing number of new 52-week lows deserves particular attention. These statistics suggest that selling pressure remains broad and that the market has not yet demonstrated convincing signs of stabilization.
Technical Outlook: The TSX Remains in a Vulnerable Position
From a technical perspective, the TSX Composite Index closed below its 21-day, 50-day, and 200-day moving averages.
This is an important development because the index has now moved below several widely followed technical reference points. Its deterioration over the past several weeks has increased the risk facing traders and investors, particularly following its decline below the 50-day moving average.
The market’s inability to maintain these moving averages, combined with six consecutive sessions of losses and persistently negative market breadth, suggests that the prevailing market trend remains unfavourable.
At this stage, traders should be cautious about attempting to anticipate a bottom or assuming that the market is due for an immediate recovery simply because it has experienced several consecutive sessions of declines.
A meaningful turnaround should be supported by observable improvements in market behaviour, including stronger market breadth, a reduction in the number of stocks making new 52-week lows, improving price action, and the eventual recovery of important technical levels.
Until such developments occur, the technical outlook should be regarded as defensive.
.
Key Takeaways for Traders and Investors
The following considerations deserve particular attention as traders and investors prepare for the next trading sessions.
1. Capital preservation should remain the priority: With the TSX experiencing consecutive sessions of declines and market internals continuing to deteriorate, protecting existing capital should take precedence over pursuing new trading opportunities.
One defensive approach is to consider limiting overall market exposure to approximately 10%–15% of portfolio value while waiting for more convincing evidence of market stabilization. This is a conservative risk-management guideline rather than a universally appropriate allocation; individual circumstances, existing positions, and risk tolerance should also be considered.
2. Do not mistake an oversold market for a market that has completed its decline: A market that has experienced several consecutive sessions of losses may eventually produce a technical rebound. However, a rebound does not necessarily signal the beginning of a new uptrend.
Traders should avoid confusing temporary relief rallies with genuine trend reversals.
3. Pay close attention to market breadth and new 52-week lows: The decliner-to-advancer ratio of 4.08 to 1 and the 497 new 52-week lows are particularly concerning.
These indicators suggest that weakness is widespread across individual stocks. A sustained improvement in market breadth, accompanied by fewer new lows and more advancing stocks, would provide a more encouraging indication that selling pressure is beginning to subside.
4. Be selective when evaluating individual stock opportunities: Some stocks may continue to demonstrate relative strength even when the broader market is declining. Communications and Utilities provided examples of such resilience on Friday.
However, relative strength alone is not sufficient justification for entering a position. Traders should also evaluate price trends, trading volume, technical support, resistance levels, and the overall market environment.
5. Wait for confirmation before committing significant capital: The most important consideration is to avoid prematurely anticipating a market bottom.
A confirmed improvement in market breadth, stronger participation across sectors, recovery of important moving averages, and sustained positive price action would provide more compelling evidence of a developing market turnaround.
Until then, maintaining a defensive posture and exercising patience may be more rewarding than aggressively pursuing uncertain opportunities.
Final Market Assessment
Friday’s trading session reinforced the message that the TSX remains under considerable pressure. The index’s continued decline, negative market breadth, substantial increase in trading volume, and expanding number of new 52-week lows collectively point to a market environment that warrants considerable caution.
Although a few sectors and individual stocks demonstrated relative strength, their performances were not sufficient to offset the widespread weakness across the broader market.
For traders, this is an environment in which risk management, selectivity, and capital preservation should take precedence over aggressive trading.
For longer-term investors, patience may be particularly important. There is no need to rush into significant new positions simply because stock prices have declined. Better opportunities may emerge once the market establishes a more convincing foundation for recovery.
The bottom line: Protect capital first. Remain patient, monitor market internals, and wait for convincing confirmation of a sustainable market turnaround before substantially increasing market exposure.
.
The US Markets
Friday’s U.S. Market Indexes: A Broad-Based Market Sell-Off Raises Serious Concerns
Major U.S. Indexes Suffer Significant Losses
The major U.S. stock market indexes ended Friday’s trading session deep in negative territory, recording substantial losses across the board.
The Dow Jones Industrial Average plunged 949.73 points, or 1.93%, to close at 48,147.33. The S&P 500 declined 265.44 points, or 3.70%, finishing at 6,910.39. The Nasdaq Composite suffered an even steeper decline of 1,261.47 points, or 5.28%, to close at 22,617.73. Meanwhile, the Russell 2000 fell 73.32 points, or 2.76%, ending the session at 2,581.79.

The magnitude of Friday’s losses was particularly concerning. All four major indexes declined by at least approximately 2%, with the S&P 500 losing nearly 4% and the Nasdaq Composite falling by more than 5%.
This was not an ordinary market pullback. The sell-off was broad-based, affecting both large-cap and small-cap stocks. There appeared to be very few places for investors to seek shelter as selling pressure spread across the market.
Under normal market conditions, a stock declining 5% in a single session would warrant a closer examination of its price chart, technical indicators, trading volume, and underlying fundamentals. However, the current market environment presents a different challenge. The combination of extreme uncertainty, unpredictability, and rapidly changing market conditions has created an environment of unusually high volatility.
Investors and traders must therefore look beyond individual stock performance and carefully examine the broader forces driving market movements. External developments, including geopolitical uncertainties and other macroeconomic concerns, may be contributing to the market’s instability.
The extent of Friday’s sell-off reinforces the importance of understanding the prevailing market environment before making significant investment or trading commitments.
Intraday Market Behaviour: Selling Pressure Intensified Toward the Close
The major indexes followed a remarkably similar pattern throughout Friday’s trading session.
The indexes initially opened higher and maintained their positive positions for slightly less than the first half-hour of trading. However, the early strength quickly faded, and selling pressure intensified as the session progressed.
The indexes subsequently moved progressively lower, with losses becoming increasingly pronounced toward the end of the trading session.
This pattern is particularly concerning because the market failed to sustain its early strength. Instead, sellers maintained control for most of the session, pushing the major indexes substantially lower by the closing bell.
The synchronized weakness across the Dow Jones, S&P 500, Nasdaq Composite, and Russell 2000 also suggests that Friday’s selling was not confined to one particular segment of the market.
For traders, this type of price behaviour warrants caution. An inability to sustain early gains, followed by increasingly aggressive selling, can indicate that market participants remain unwilling to take on significant risk.
Technical Analysis of the Major U.S. Indexes
The technical condition of the major U.S. indexes has deteriorated considerably. All four indexes closed below their respective 21-day, 50-day, and 200-day moving averages, according to the supplied chart observations.
These moving averages are important technical reference points used by traders and investors to assess short-, intermediate-, and longer-term market trends.
Dow Jones Industrial Average: The Dow Jones Industrial Average closed Friday at 48,147.33, substantially below all three of its major moving averages.
Based on the chart measurements provided:
- The index closed approximately 2,800 points below its 21-day moving average.
- It finished approximately 3,750 points below its 50-day moving average.
- It closed approximately 2,750 points below its 200-day moving average.
The index also experienced a pronounced downward gap below all three moving averages.
This is a significant technical deterioration. The extent of the separation between the index and its moving averages highlights the severity of the recent decline and the increased technical risk facing market participants.
The Dow’s position below its 200-day moving average is particularly noteworthy because this moving average is widely followed as a reference for the market’s longer-term trend.
Nasdaq Composite: The Nasdaq Composite suffered the largest percentage decline among the four major indexes, falling 5.28% to close at 22,617.73.
The Nasdaq’s technical picture requires considerable attention.
Interestingly, the 21-day and 200-day moving averages are now almost coinciding, while the 50-day moving average remains considerably higher.
In other words, the short-term and longer-term moving averages have moved close to one another, while the intermediate-term moving average remains above both.
The Nasdaq closed below all three moving averages, reflecting substantial technical weakness.
The index’s position is particularly concerning because the sharp decline has erased its gains for the year, according to the supplied market assessment.
The Nasdaq’s technical condition will require considerable improvement before traders can reasonably regard the market as having established a sustainable recovery.
S&P 500 Index: The S&P 500 declined 3.70% to close at 6,910.39.
The index finished well below its 21-day moving average and even further below its 50-day moving average. The 50-day moving average remains considerably higher than the shorter-term average.
The S&P 500 also closed below its 200-day moving average, although the gap was smaller than its distance below the 50-day moving average.
The deterioration in the S&P 500 is especially important because the index represents a broad cross-section of large U.S. companies.
Its position below all three moving averages indicates that the weakness is no longer limited to a short-term correction. The intermediate- and longer-term technical outlooks have also become increasingly vulnerable.
Russell 2000 Index: The Russell 2000 declined 2.76% to close at 2,581.79.
The index remains below its 21-day, 50-day, and 200-day moving averages.
The Russell 2000’s weakness is particularly noteworthy because it represents the small-cap segment of the U.S. equity market.
Its decline alongside the large-cap indexes reinforces the observation that Friday’s sell-off was broad-based rather than concentrated in a handful of major technology companies.
The simultaneous weakness in large-cap and small-cap stocks also suggests that investors should not assume that rotating away from large technology companies into smaller companies will necessarily provide adequate protection in the current environment.
Key Takeaways for Traders and Investors
Friday’s market performance offers several important lessons and considerations for the next trading sessions.
1. Capital preservation should take precedence over aggressive trading.
The magnitude and breadth of Friday’s declines warrant a defensive approach. With all four major indexes trading below their 21-day, 50-day, and 200-day moving averages, the overall market environment remains unfavourable.
Traders and investors should carefully evaluate their existing market exposure and consider whether their portfolios are adequately protected against further declines.
2. Do not assume that a sharp decline automatically creates a buying opportunity.
Substantial declines can eventually create attractive opportunities. However, lower prices alone do not establish that a stock or index has reached a sustainable bottom.
Attempting to catch a falling market without evidence of stabilization can expose traders to additional losses.
3. Monitor the major moving averages closely.
The 21-day, 50-day, and 200-day moving averages should remain important reference points in assessing the market’s technical recovery.
A meaningful improvement in price action, followed by the recovery of these moving averages, would provide more encouraging evidence of a potential trend reversal.
4. Pay attention to the behaviour of both large-cap and small-cap stocks.
Friday’s losses affected all four major indexes, including the Russell 2000.
This broad-based weakness suggests that the current market risk extends beyond the technology sector and the largest publicly traded companies.
5. Be cautious about trading short-term rebounds.
After such substantial declines, the market may experience temporary rebounds or relief rallies.
However, traders should distinguish between a technical bounce and a genuine recovery. Improving market breadth, sustained buying interest, and stronger price action would be important factors in assessing whether a rebound has the potential to develop into a more sustainable uptrend.
6. Avoid making major commitments while market direction remains uncertain.
The current combination of volatility, technical deterioration, and external uncertainties makes it particularly important to remain selective.
There is no need to participate aggressively in every market movement. Waiting for better conditions and clearer signals can be a legitimate trading and investment decision.
Final Market Assessment
Friday’s trading session was a particularly damaging one for the U.S. stock market.
The magnitude of the losses, the synchronized declines across large-cap and small-cap indexes, the inability of the market to maintain its early gains, and the position of all four major indexes below their principal moving averages collectively paint a concerning picture.
The technical damage is substantial, and the market has not yet provided convincing evidence that the selling pressure has run its course.
Although external developments, including geopolitical uncertainties, may continue to influence investor sentiment, traders should avoid relying on predictions about when these uncertainties will disappear. Instead, attention should remain focused on observable market behaviour, technical developments, and the effectiveness of existing risk-management measures.
For the time being, a defensive investment posture appears more appropriate than an aggressive one.
The bottom line: Friday’s market action was a serious warning. Protect capital, reduce unnecessary exposure, remain selective, and do not rush back into the market until there is convincing evidence of stabilization and a confirmed improvement in the prevailing trend.
Friday’s U.S. Market Statistics
NYSE and Nasdaq Market Internals Continue to Signal Serious Weakness
Friday’s market statistics provide further evidence of deteriorating conditions across the U.S. stock market. Both the New York Stock Exchange (NYSE) and Nasdaq recorded overwhelmingly negative market breadth, substantial numbers of new 52-week lows, and higher trading volumes.
These developments suggest that selling pressure remains widespread and that neither exchange has yet demonstrated convincing signs of market stabilization.
1. New York Stock Exchange (NYSE)
Market Breadth: Seven Consecutive Sessions of Negative Readings
At the New York Stock Exchange, declining issues significantly outnumbered advancing issues.
Specifically, there were 2,199 declining issues, compared with only 536 advancing issues, while another 74 issues closed unchanged.
This produced a decliner-to-advancer ratio of approximately 4.10 to 1, meaning that roughly four stocks declined for every stock that advanced.
Market breadth was therefore decisively negative. More importantly, Friday marked the seventh consecutive trading session of negative NYSE market breadth.
Seven consecutive sessions of negative breadth represent a concerning development. It suggests that selling pressure is not an isolated occurrence but has persisted across multiple trading sessions, affecting a substantial number of listed companies.
New 52-Week Highs and Lows: Selling Pressure Continues to Expand
The NYSE recorded 17 new 52-week highs and 594 new 52-week lows on Friday, compared with 15 new highs and 461 new lows in the previous session.
The number of new 52-week highs increased by approximately 13%, while the number of new 52-week lows increased by approximately 29%.
The imbalance between new highs and new lows remains particularly concerning.
Only 17 stocks reached new 52-week highs, compared with 594 stocks establishing new 52-week lows. This translates into a new-high-to-new-low ratio of approximately 0.03, or roughly three new highs for every 100 new lows.
The equivalent ratio yesterday was also approximately 0.03.
Although the ratio remained essentially unchanged, the absolute number of stocks making new lows increased considerably. This indicates that the weakness in the broader market remains extensive.
The market’s internal indicators continue to reflect a seriously weakened environment, with very few stocks demonstrating sufficient strength to establish new annual highs.
Trading Volume: Higher Activity Amid Widespread Declines
Total NYSE trading volume reached 6,804,244,377 shares, representing an increase of approximately 29% from the previous session’s volume of 5,259,113,529 shares.
The combination of higher trading volume, substantially more declining stocks than advancing stocks, and a growing number of new 52-week lows warrants particular attention.
Higher volume during a session characterized by widespread declines suggests significant trading activity amid persistent selling pressure.
Overall, the NYSE’s market internals remain seriously weakened. The exchange has yet to demonstrate meaningful improvement in breadth or the balance between new highs and new lows.
The prevailing conditions continue to present considerable risks for traders and investors. Caution, selectivity, and capital preservation should remain priorities.
2. Nasdaq Market Statistics
Market Breadth: Five Consecutive Sessions of Negative Readings
The Nasdaq also recorded overwhelmingly negative market breadth on Friday.
There were 4,063 declining issues compared with only 938 advancing issues, while 195 issues closed unchanged.
This produced a decliner-to-advancer ratio of approximately 4.33 to 1, meaning that more than four stocks declined for every stock that advanced.
Friday marked the fifth consecutive trading session of negative Nasdaq market breadth.
This persistent imbalance indicates that selling pressure remains widespread across Nasdaq-listed stocks.
The magnitude of the negative breadth is particularly concerning when considered alongside the Nasdaq Composite’s substantial 5.28% decline on Friday.
New 52-Week Highs and Lows: Market Internals Remain Extremely Weak
The Nasdaq recorded 67 new 52-week highs and 1,370 new 52-week lows on Friday, compared with 45 new highs and 799 new lows in the previous session.
The number of new 52-week highs increased by approximately 49%, while the number of new 52-week lows increased by approximately 71%.
Despite the increase in new highs, the number of stocks reaching new lows remains overwhelmingly larger.
The ratio of new 52-week highs to new 52-week lows was approximately 0.05, or 5%, on Friday. Yesterday’s corresponding ratio was approximately 0.056, or 5.6%.
This represents a modest deterioration in the relative balance between new highs and new lows.
In practical terms, for every 100 stocks establishing new 52-week lows, only approximately five stocks established new 52-week highs.
Although the ratio has not deteriorated dramatically from the previous session, the absolute number of new lows has increased substantially.
The Nasdaq’s internal indicators therefore remain extremely weak. There is currently little evidence of a broad-based improvement in the underlying condition of the exchange.
Trading Volume: Sellers Remain in Control
Total Nasdaq trading volume reached 12,888,136,103 shares, approximately 18% higher than the previous session’s volume of 10,917,050,887 shares.
The increased trading activity occurred alongside a substantial decline in the Nasdaq Composite, which fell 5.28% on Friday.
The combination of sharply lower prices, negative market breadth, a large number of new 52-week lows, and higher trading volume suggests that sellers maintained considerable control of the market.
The Nasdaq continues to exhibit characteristics of a bearish market environment.
Its underlying market statistics do not yet provide convincing evidence that selling pressure is subsiding or that a sustainable recovery is developing.
3. What These Market Statistics Mean for Traders and Investors
The NYSE and Nasdaq statistics collectively paint a concerning picture.
Both exchanges continue to experience persistently negative market breadth, while the number of stocks establishing new 52-week lows remains substantially greater than the number establishing new highs.
The NYSE has recorded seven consecutive sessions of negative breadth, while the Nasdaq has recorded five consecutive sessions.
These developments are important because market indexes can sometimes conceal the extent of weakness among individual stocks. Market breadth and new-high/new-low statistics help traders and investors look beyond the headline index numbers and assess what is happening beneath the surface.
At present, the underlying market conditions remain unfavourable.
Key Takeaways for Traders and Investors
1. Capital preservation should be the immediate priority.
The current market environment presents elevated risks. Traders and investors should carefully evaluate their existing positions and consider reducing exposure where appropriate.
For particularly risk-averse investors, moving to an entirely cash position is a reasonable defensive option to consider under these conditions. Cash also provides flexibility to take advantage of opportunities when market conditions eventually improve.
2. Do not rush into buying stocks simply because prices have declined.
A substantial decline does not automatically mean that a stock has reached an attractive entry point.
Stocks can continue declining even after experiencing significant losses. Traders should avoid attempting to predict market bottoms without supporting evidence.
3. Continue monitoring market breadth and new 52-week highs and lows.
These indicators deserve close attention in the coming sessions.
A meaningful improvement would ideally include fewer declining stocks, more advancing stocks, a reduction in new 52-week lows, and a sustained improvement in the balance between new highs and new lows.
4. Build and maintain a watchlist.
This is an appropriate time to identify potentially attractive stocks and monitor their price behaviour.
Investors can use the current period to research companies, evaluate fundamentals, examine technical charts, and establish potential entry and exit levels.
Having a prepared watchlist can make it easier to respond when market conditions improve.
5. Wait for confirmation of a market turnaround.
A single positive trading session or a short-lived technical rebound should not be interpreted as confirmation of a new uptrend.
A more convincing recovery should be accompanied by improving market breadth, fewer new lows, stronger trading participation, and improvements in the major indexes’ technical positions.
4. Final Market Assessment
The U.S. stock market continues to struggle, and Friday’s statistics provide little reason to conclude that conditions are improving.
The NYSE and Nasdaq both recorded substantially more declining stocks than advancing stocks. New 52-week lows continued to outnumber new highs by very wide margins, while trading volume increased on both exchanges.
The Nasdaq’s particularly severe decline of 5.28% reinforces the extent of the current market weakness.
The technical condition of the major indexes, together with the persistent deterioration in market internals, suggests that the prevailing market trend remains bearish.
There is no reliable way to determine precisely when market conditions will improve. Markets will ultimately establish their own direction, and traders and investors must remain prepared to respond to changing conditions rather than attempting to predict every market movement.
The immediate focus should therefore remain on protecting existing capital, maintaining appropriate risk-management measures, and preparing for better opportunities.
The bottom line: This is a market environment that calls for caution rather than aggression. Maintaining substantial cash reserves, building a watchlist, monitoring market internals, and waiting for convincing evidence of a sustainable market turnaround may be the more prudent course of action.
[restict]
Friday’s U.S. Market Wrap-Up Report
Technology-Led Sell-Off Deepens as Market-Wide Selling Pressure Intensifies
A Particularly Damaging Session for U.S. Equities
Friday was another broadly negative trading session for the U.S. stock market. Not only was it the second consecutive session of widespread losses, but the magnitude of the declines was considerably worse than Thursday’s performance.
The Nasdaq Composite was particularly hard hit, plunging 5.28%, while the other major indexes also suffered substantial losses. The Dow Jones Industrial Average declined 1.93%, the S&P 500 fell 3.70%, and the Russell 2000 lost 2.76%.
The market’s weakness was especially pronounced among technology stocks, as investors appeared increasingly reluctant to continue supporting AI-related companies and businesses associated with data-centre infrastructure.
Concerns about the enormous capital investments required to develop AI infrastructure, the uncertainty surrounding future returns on those investments, and the possibility that current valuations have become excessive appear to be weighing heavily on investor sentiment.
Friday’s sell-off suggests that these concerns have moved beyond isolated weakness in individual technology companies and are increasingly affecting the broader market.
U.S. Treasury yields also declined, with the 10-year Treasury yield falling 1.8 basis points to 5.05%. However, the decline in Treasury yields did little to support equity prices as investors continued to reduce their exposure to stocks.
The breadth and magnitude of Friday’s losses made this a particularly damaging trading session. Both large-cap and small-cap stocks participated in the decline, leaving investors with very few areas of meaningful protection.
Sector Performance: Technology and Materials Lead the Declines
Friday’s sector performance reflected the extent of the selling pressure, particularly in technology-related and economically sensitive areas of the market.
Consumer Non-Durables was the best-performing sector, gaining a relatively modest 1.14%. Utilities followed with an advance of 1.10%, while Consumer Services gained 0.86%.
These were the only sectors in the supplied performance figures to finish in positive territory.
Among the declining sectors, Health Technology fell 0.99%, Retail Trade declined 1.14%, Commercial Services lost 1.27%, and Distribution Services dropped 1.32%.
The declines became considerably more pronounced in other sectors. Transportation fell 2.37%, Finance declined 3.18%, and Health Services suffered a substantial loss of 10.30%.
Technology Services, Non-Energy Minerals, and Electronic Technology were among the worst-performing sectors, declining 14.47%, 18.70%, and 20.21%, respectively.
The exceptionally poor performance of Electronic Technology and Technology Services underscores the extent to which investors are reassessing their exposure to technology-related businesses.
Consumer Non-Durables and Utilities demonstrated relative resilience. However, their modest gains should be viewed in the context of the broader market collapse rather than interpreted as evidence of a meaningful market recovery.
The sector rotation currently taking place appears increasingly defensive and disorderly. Investors should be careful about assuming that any sector demonstrating relative strength during a severe sell-off will necessarily continue to outperform.
Company News and Individual Stock Developments
Anthropic and SentinelOne: Anthropic (ANT), following its sharp advance on Thursday after its IPO debut, reversed course on Friday and plunged 8.5%.
The sharp reversal illustrates how quickly sentiment can change in the current market environment, particularly for newly listed or highly valued technology-related companies.
SentinelOne (S), meanwhile, attracted attention following news of a planned collaboration with Singapore’s Defense Cyber Command, part of the Digital and Intelligence Service.
According to the reported announcement, the collaboration will explore opportunities to strengthen cybersecurity and promote secure AI across Singapore’s defence and critical infrastructure sectors.
The areas of potential cooperation include cybersecurity technology, threat intelligence, research, training, and capacity building.
SentinelOne shares had gained 7.6% on Thursday but reversed lower on Friday, declining 4.5%.
Despite Friday’s setback, SentinelOne is a company worth adding to a technology-sector watchlist. Its cybersecurity business and reported collaboration with Singapore’s defence establishment provide developments worth monitoring.
However, traders should wait for favourable technical developments and improved market conditions before considering a significant position.
NVIDIA and SanDisk Experience Severe Selling Pressure: Technology stocks experienced some of their most damaging declines on Friday.
The market’s growing reluctance to continue supporting AI-related investments appears to have intensified, particularly amid concerns about the substantial capital expenditures required for AI development and the uncertainty surrounding the returns those investments may eventually generate.
SanDisk Corporation (SNDK) plunged 16.05% on Friday and lost approximately 28% for the entire week.
NVIDIA (NVDA) suffered an even more substantial setback, declining 14.01% on Friday and approximately 23% for the week.
The selling pressure surrounding NVIDIA was particularly noteworthy given the company’s central position in the AI infrastructure investment cycle.
Reuters also reported that the U.S. Securities and Exchange Commission was examining the company’s accounting practices. This is a development investors should follow carefully, while distinguishing reported regulatory scrutiny from any established finding of wrongdoing.
The simultaneous weakness in these prominent technology companies highlights the extent of the current reassessment of AI-related investments.
For traders, the important consideration is that even market-leading technology companies can experience substantial losses when investor sentiment changes rapidly.
Hewlett Packard Enterprise Suffers Seventh Consecutive Session of Losses
Hewlett Packard Enterprise (HPE) was another notable technology-sector casualty on Friday.
The company’s shares plunged 10.1% to close at $40.91, extending their losing streak to seven consecutive trading sessions.
HPE now trades approximately 44.4% below its 52-week high of $73.56, reached on October 9.
The stock also underperformed several major technology-sector peers:
- Apple Inc. (AAPL) declined 1.9% to close at $342.56.
- Microsoft Corporation (MSFT) fell 2.8% to close at $484.52.
- Cisco Systems Inc. (CSCO) declined 4.29% to finish at $90.64.
HPE traded approximately 21.2 million shares, compared with its 50-day average daily volume of 18.8 million shares.
The combination of a substantial price decline, consecutive losing sessions, and trading volume above its 50-day average suggests considerable selling interest.
HPE’s performance also reinforces the broader weakness affecting companies associated with technology infrastructure.
Next Week: Corporate Earnings and Inflation Data in Focus
Despite the widespread technology-sector weakness, several upcoming corporate earnings announcements may provide investors with additional information about the underlying health of the technology and infrastructure businesses.
Hewlett Packard Enterprise, Agilent Technologies (A), and Dell Technologies (DELL) are among the companies to watch.
Their earnings reports and management commentary may offer useful insights into business demand, technology spending, infrastructure investment, and the outlook for future growth.
Investors will be particularly interested in whether these companies provide encouraging guidance that could help restore confidence in technology-related stocks.
However, earnings announcements alone may not be sufficient to reverse the prevailing market weakness.
The October Personal Consumption Expenditures (PCE) inflation report, identified in the supplied draft as an upcoming release, is another potentially important development. Investors should verify its publication date against the official economic calendar before trading around it.
Inflation data can influence expectations about Federal Reserve monetary policy, Treasury yields, and equity valuations.
In the current environment, traders should be prepared for potentially significant price movements surrounding both corporate earnings and economic announcements.
Market Internals: The Underlying Market Condition Remains Extremely Weak
Friday’s market statistics provide further confirmation that the weakness in U.S. equities extends well beyond the major technology stocks.
At the New York Stock Exchange, declining issues outnumbered advancing issues by approximately 4.10 to 1. There were 2,199 decliners compared with 536 advancers.
The NYSE has now recorded seven consecutive sessions of negative market breadth.
The exchange also recorded 594 new 52-week lows against only 17 new highs. This is a particularly concerning imbalance, indicating that a substantial number of individual stocks are experiencing significant technical deterioration.
NYSE trading volume increased approximately 29% to 6.80 billion shares.
The Nasdaq’s market internals were similarly weak.
Declining stocks outnumbered advancing stocks by approximately 4.33 to 1, with 4,063 decliners and only 938 advancers.
Friday marked the fifth consecutive session of negative Nasdaq market breadth.
The Nasdaq also recorded 1,370 new 52-week lows against just 67 new highs. In other words, for every 100 stocks making new 52-week lows, only approximately five stocks reached new 52-week highs.
Nasdaq trading volume increased approximately 18% to 12.89 billion shares.
These figures are particularly important because they reveal the extent of the market weakness beneath the headline index performances.
The negative breadth, overwhelming number of new 52-week lows, and increased trading volumes collectively suggest that sellers remain firmly in control.
There is currently little evidence of a meaningful improvement in the underlying market condition.
Technical Outlook: All Four Major Indexes Remain Below Key Moving Averages
The technical condition of the U.S. market has deteriorated substantially.
The Dow Jones Industrial Average, S&P 500, Nasdaq Composite, and Russell 2000 all closed below their respective 21-day, 50-day, and 200-day moving averages.
This is an important development because it indicates that the weakness extends across the short-, intermediate-, and longer-term technical perspectives.
The Dow Jones closed at 48,147.33, approximately 2,800 points below its 21-day moving average, 3,750 points below its 50-day moving average, and 2,750 points below its 200-day moving average.
The Nasdaq Composite suffered the largest percentage decline, falling 5.28%. Its 21-day and 200-day moving averages are now almost coinciding, while its 50-day moving average remains considerably higher. The index closed below all three averages, reflecting substantial technical deterioration.
The S&P 500 finished at 6,910.39, well below its 21-day and 50-day moving averages and also below its 200-day moving average.
The Russell 2000 closed at 2,581.79, remaining below all three of its major moving averages.
The simultaneous weakness across all four indexes is a significant warning for traders and investors. The market has not yet established a convincing technical foundation for recovery.
A meaningful improvement would require more than a single positive session. Traders should look for sustained buying interest, improving market breadth, fewer new 52-week lows, and eventual recovery of important technical levels.
Until these developments occur, the technical outlook remains bearish and market risk remains elevated.
Key Takeaways for Traders and Investors
Friday’s market performance provides several important lessons and considerations for the next trading sessions.
1. Capital preservation should take priority over aggressive trading.
The current market environment presents substantial risks. With all four major indexes below their principal moving averages and market internals severely weakened, traders and investors should carefully reassess their existing exposure.
A substantial cash position, potentially even 100% cash for particularly defensive investors, is a reasonable option to consider while market conditions remain unfavourable.
There is no obligation to remain fully invested during a deteriorating market.
2. Do not assume that technology stocks have reached their bottom.
The substantial declines in NVIDIA, SanDisk, HPE, and other technology-related companies demonstrate the risks associated with attempting to anticipate a bottom.
Even companies with strong businesses and promising long-term prospects can experience further substantial declines when valuations, investor expectations, and market sentiment change.
3. Monitor the NYSE and Nasdaq market internals.
Market breadth and new 52-week highs and lows should remain among the most important indicators to watch.
A sustained reduction in new lows, accompanied by improving breadth, would be an encouraging early indication that selling pressure may be subsiding.
4. Build a watchlist rather than rushing into new positions.
Use this period to identify companies with strong fundamentals, competitive advantages, sound financial positions, and attractive long-term prospects.
Pay particular attention to companies that demonstrate relative strength during market weakness.
SentinelOne, HPE, Dell Technologies, and Agilent Technologies are among the names worth monitoring for their respective business developments and upcoming corporate announcements.
Being prepared is preferable to making rushed decisions when market conditions eventually improve.
5. Treat earnings announcements and economic releases with caution.
Upcoming earnings reports and inflation data could create additional volatility.
Traders should avoid assuming that favourable corporate results will automatically translate into rising share prices, particularly while the broader market remains under significant selling pressure.
6. Wait for convincing confirmation of a market turnaround.
A technical rebound is not necessarily the beginning of a new bull market.
Look for improving market breadth, fewer new 52-week lows, stronger participation across sectors, and sustained recovery above important moving averages.
The objective should be to participate when the market begins demonstrating genuine strength rather than attempting to predict precisely when the bottom will occur.
[/restrict]
Final Market Assessment: A Defensive Posture Remains Appropriate
Friday’s trading session was exceptionally damaging for the U.S. stock market.
The Nasdaq’s 5.28% decline, the S&P 500’s 3.70% loss, and substantial weakness in both large-cap and small-cap stocks demonstrate the severity of the current market environment.
The technology sector was particularly hard hit as investors continued to reassess AI-related investments, data-centre infrastructure spending, and the potential returns associated with the enormous capital commitments being made by companies in this industry.
However, the deterioration in market breadth and the extraordinary number of new 52-week lows indicate that the problem is much broader than technology alone.
The NYSE and Nasdaq market internals remain severely weakened. All four major indexes are trading below their 21-day, 50-day, and 200-day moving averages, and Friday’s increased trading volumes occurred alongside substantial market declines.
Taken together, these developments indicate that the prevailing market trend remains bearish and that the risks facing traders and investors are elevated.
There may eventually be attractive opportunities in technology and other sectors, particularly among companies whose share prices have declined substantially despite having sound underlying businesses. However, identifying such opportunities does not mean that investors should rush to establish positions before the market demonstrates signs of stabilization.
For now, patience, selectivity, and disciplined risk management are essential.
The bottom line: This is not an environment for aggressive market participation. Protect your capital, seriously consider maintaining a substantial cash position, continue building your watchlist, and wait for convincing improvements in market internals and technical conditions before committing significant capital.
.
NOTICE TO READERS
The Canadian Vanguard Stock Market is about empowering you to build and manage your wealth by yourself. There is certainly no magic in managing finances or wealth but one needs to know what to do and commit to doing what is needed. When you are ready to start the journey to Take Charge and Put Your Destiny In Your Own Hands, start with reading The Canadian Vanguard every market day. If and when you need more related information or to advertise your business products or services in The Canadian Vanguard, Contact Us
Our readers are strongly advised to conduct their own research into individual stocks before making a purchase decision. In addition, investors are advised that past stock performance is no guarantee of future price appreciation. Any recommendation is not a guarantee of any particular stock’s future prices, and The Canadian Vanguard accepts no responsibility or liability for investors’ or readers’ purchases.
The dollar sign “$” in the Toronto Market section in the articles only stands for Canadian dollar and in the US market section “$” stands for US dollar.
(c) This article is published by The Canadian Vanguard on November 20, 2026