






Major Indexes Retreat Despite Easing Bond Yields and Lower Oil Prices
The Canadian Vanguard Stock Market Report – Tuesday November 17, 2026 Edition
Tuesday’s Toronto Market Index
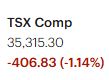
The S&P/TSX Composite Index declined 406.83 points, or 1.14%, to close at 35,315.30.

The Toronto market has now recorded four consecutive sessions of losses. Developments surrounding artificial intelligence (AI) have continued to influence market sentiment, with ongoing concerns involving Nvidia Corp.’s executives adding pressure to North American markets.
However, the TSX and the broader Toronto market are generally less heavily weighted toward technology stocks and are therefore less sensitive to AI-driven market developments and concerns. The Canadian market has greater exposure to the financial, energy, and precious metals sectors.
Market breadth was negative today, marking the fourth consecutive session of negative breadth. This continued weakness suggests that selling pressure remains widespread across the market.
Traders and investors should remain focused on implementing appropriate capital-protection measures, including disciplined risk-management guidelines and clearly defined investment rules. One consideration is to limit market exposure to approximately 15%–30% of total portfolio value for the time being. This may help preserve capital while awaiting a market turnaround that is both established and technically confirmed.
Despite today’s decline, the TSX Composite Index closed above its 21-day and 50-day moving averages and continues to maintain a comfortable distance above its 200-day moving average. This remains a constructive technical consideration, although continued market weakness warrants caution.
Investment Outlook: Maintaining a defensive posture, managing exposure, and protecting capital should remain priorities until the market demonstrates convincing signs of a sustained recovery.
Tuesday’s TSX Market Statistics
At the Toronto Stock Exchange (TSX), declining issues (decliners) significantly outnumbered advancing issues (advancers). Specifically, there were 1,726 decliners and 568 advancers, resulting in a decliner-to-advancer ratio of approximately 3.04 to 1. In other words, there were approximately three declining stocks for every advancing stock. An additional 298 issues closed unchanged. Overall, market breadth was decidedly negative.
The exchange recorded 24 new 52-week highs and 178 new 52-week lows, compared with 80 new 52-week highs and 158 new 52-week lows in the previous trading session.
The number of new 52-week highs declined sharply by 70% compared with the previous session. Furthermore, the ratio of new 52-week highs to new 52-week lows stood at approximately 0.13, or 13%, today, compared with 0.51, or 51%, yesterday. This indicates a significant deterioration in the market’s high-to-low readings. On both trading days, the number of stocks recording new 52-week lows exceeded those reaching new highs.
Overall, these indicators suggest that the market’s internal strength continues to deteriorate, with persistent weakness across several important breadth indicators.
Total trading volume on the TSX also declined today, reaching 534,806,298 shares. This represented a decrease of approximately 12% from the 607,572,740 shares traded in the previous session.
Investors and traders should continue to monitor the market’s internal statistics closely. These indicators can provide valuable early clues about changes in market direction and help identify the initial stages of a potential turnaround.
Furthermore, it is prudent to wait for convincing confirmation of a market reversal and the establishment of a sustainable uptrend before committing capital to major or significant new positions. Preserving capital and exercising patience remain important priorities under current market conditions.
Tuesday’s Toronto TSX Market Wrap-Up Report
The S&P/TSX Composite Index declined again today, extending its losing streak to four consecutive trading sessions. Notably, the market’s daily losses have become progressively larger over this period, suggesting that selling pressure has been intensifying.
Sector Performance
Among the market sectors, Commercial Services, Health Technology, and Communications were the three strongest performers today, gaining 9.92%, 7.77%, and 6.87%, respectively.
Utilities, Transportation, and Industrial Services also recorded gains of 6.45%, 5.14%, and 2.88%, respectively, placing them among the better-performing sectors during today’s session.
On the weaker side, Distribution Services declined 8.43%, Non-Energy Minerals fell 11.10%, and Electronic Technology dropped 12.75%. These were the three weakest-performing sectors today.
Overall, sector performance was mixed, with some areas recording notable gains while others experienced substantial losses.
Canadian Banking Industry Update
All six of Canada’s major banks finished lower today, reflecting the broader weakness in the financial sector.
The following summarizes their performance:
- Bank of Montreal (BMO): Declined 2.05% to close at $237.98, with approximately 2.6 million shares traded.
- Toronto-Dominion Bank (TD): Fell 1.79% to close at $171.08, with approximately 2.6 million shares traded.
- Bank of Nova Scotia (Scotiabank): Declined 1.76% to close at $127.43, with 3,797,731 shares traded.
- Canadian Imperial Bank of Commerce (CIBC): Fell 1.76% to close at $159.95, with 3,060,986 shares traded.
- Royal Bank of Canada (RBC): Declined 1.64% to close at $280.99, with 3,789,652 shares traded.
- National Bank of Canada: Fell 1.16% to close at $210.04, with 1,149,370 shares traded.
Although all six major banks declined, the losses were relatively contained. Five of the six banks recorded declines of less than 1.8%, while Bank of Montreal experienced the largest decline at 2.05%.
Manulife Financial Corporation
Although Manulife Financial Corporation is not a bank, it is worth including in this comparison because it is a significant constituent of the broader Financials sector.
Unlike the six major banks, Manulife finished the session in positive territory, gaining 0.19% to close at $62.67, with 3,408,779 shares traded.
Manulife currently pays a quarterly dividend of $0.49 per share, equivalent to an annualized dividend of $1.96 per share. Based on today’s closing price of $62.67, this represents an indicated annual dividend yield of approximately 3.13%.
An important dividend consideration: Manulife’s quarterly dividend of $0.49 and indicated yield of approximately 3.13% make it an interesting stock to compare with the six major Canadian banks from an income-investing perspective. Dividend yields, however, should be considered alongside dividend sustainability, earnings performance, and the overall financial strength of each company.
Market Observation
The broad-based weakness among Canada’s major banks is worth monitoring, particularly given the importance of the financial sector to the overall performance of the TSX. Manulife’s modest gain provides a notable contrast to the negative performance of all six major banks.
Investors should continue to monitor the financial sector, overall market breadth, and individual stock performance for signs of stabilization. Until the broader market demonstrates a convincing recovery, maintaining disciplined risk management and capital preservation should remain priorities.
Tuesday’s US Market Indexes
The major US stock market indexes ended today’s trading session in negative territory, extending the recent market weakness.
The Dow Jones Industrial Average slumped 848.75 points, or 1.64%, to close at 50,759.42. The S&P 500 declined 76.06 points, or 1.03%, finishing at 7,340.53. The Nasdaq Composite fell 181.37 points, or 0.74%, to close at 24,328.38. Meanwhile, the Russell 2000 Index declined 47.55 points, or 1.70%, ending the session at 2,742.94.
Among the four major indexes, the Russell 2000 and Dow Jones were the weakest performers, recording declines of 1.70% and 1.64%, respectively.
Although the major indexes avoided even steeper losses, the session was nevertheless concerning. The S&P 500 recorded its lowest closing level in four months. The Dow Jones also experienced considerable intraday weakness, falling more than 1,000 points at one point before recovering some of its losses to finish down 848.75 points.
Technical Outlook: Dow Jones Industrial Average: The Dow Jones has moved back above its 21-day and 50-day moving averages, although it is trading only slightly above both levels. This is a potentially encouraging technical development.
However, the index moved closer to its 200-day moving average during today’s session, although it continues to maintain a gap above that longer-term trend indicator.
Traders should monitor whether the Dow can maintain its position above the shorter-term moving averages while avoiding a further decline toward its 200-day moving average.
Technical Outlook: Nasdaq Composite: The Nasdaq continues to struggle technically. The index remains below its 21-day and 50-day moving averages, with noticeable gaps separating its current level from both indicators.
More concerning is that the Nasdaq is now trading barely below its 200-day moving average. This is an important technical development that warrants caution, particularly if the index continues to weaken.
As long as these technical conditions remain in place, traders should exercise restraint and avoid interpreting short-term recoveries as confirmation of a sustained market reversal.
Technical Outlook: S&P 500: The S&P 500 closed slightly below both its 21-day and 50-day moving averages. More importantly, the index also finished just below its 200-day moving average.
A sustained move below the 200-day moving average would represent a further deterioration in the index’s technical condition and could increase concerns about the broader market’s underlying strength.
Investors should closely monitor whether the S&P 500 can recover these important moving averages in the coming sessions.
Technical Outlook: Russell 2000: The Russell 2000 remains below its 21-day and 50-day moving averages, reflecting continued weakness among smaller-capitalization stocks.
However, the index moved closer to its 200-day moving average during today’s session. Its position relative to this longer-term moving average deserves particular attention, as a sustained breakdown below it could signal further deterioration in the small-cap market.
Overall Market Assessment
The technical condition of the major US indexes remains mixed but increasingly concerning. While the Dow Jones is holding slightly above its 21-day and 50-day moving averages, the Nasdaq continues to struggle, and both the S&P 500 and Russell 2000 are displaying signs of technical weakness.
Investors and traders should remain cautious, closely monitor the major indexes and their respective moving averages, and maintain appropriate capital-protection measures.
The priority should remain capital preservation rather than aggressive positioning until the market establishes a convincing and technically confirmed recovery.
Tuesday’s US Market Statistics
1. New York Stock Exchange (NYSE)
Market breadth on the New York Stock Exchange (NYSE) was decidedly negative today, as declining issues significantly outnumbered advancing issues. Specifically, there were 2,174 decliners, 559 advancers, and 65 issues that closed unchanged. This produced a decliner-to-advancer ratio of approximately 3.89 to 1, meaning that nearly four stocks declined for every stock that advanced.
More importantly, the NYSE has now recorded four consecutive sessions of negative market breadth, suggesting that selling pressure remains widespread.
52-Week Highs and Lows: The NYSE recorded 17 new 52-week highs and 419 new 52-week lows today, compared with 48 new highs and 368 new lows in the previous trading session.
- The deterioration in these figures is particularly concerning:
- The number of new 52-week highs declined by approximately 65% compared with yesterday.
- The number of new 52-week lows increased by approximately 14%.
- The ratio of new 52-week highs to new 52-week lows declined from approximately 0.13 yesterday to 0.04 today.
In percentage terms, today’s new-high-to-new-low ratio was approximately 4%, compared with 13% in the previous session.
These figures indicate a further deterioration in the NYSE’s internal market indicators. The number of stocks establishing new 52-week lows continues to substantially exceed the number reaching new highs. This persistent imbalance suggests that the market’s underlying strength remains weak.
Trading Volume: Total NYSE trading volume reached 5,259,113,529 shares today, approximately 1% lower than the 5,295,727,910 shares traded during the previous session.
Although trading volume declined slightly, the continued deterioration in market breadth and the substantial imbalance between new highs and new lows deserve greater attention.
NYSE Market Assessment: The NYSE’s internal market indicators weakened further today, continuing a deterioration that has been developing over several sessions.
When new 52-week lows consistently and substantially outnumber new highs, it is an indication that market participation and underlying strength are deteriorating. Such conditions warrant increased caution among investors and traders.
The current market environment presents elevated risks. Investors and traders should therefore remain defensive, exercise discipline, and be prepared to adjust or exit positions when market conditions move against their expectations.
Capital preservation should remain a high priority.
2. NASDAQ Market Statistics
Market breadth on the NASDAQ was also negative today, with declining stocks significantly outnumbering advancing stocks.
There were 3,644 decliners and 1,305 advancers, producing a decliner-to-advancer ratio of approximately 2.80 to 1. In other words, nearly three stocks declined for every stock that advanced. An additional 174 issues closed unchanged.
The negative market breadth indicates that selling pressure remains widespread across NASDAQ-listed securities.
52-Week Highs and Lows: NASDAQ recorded 32 new 52-week highs and 783 new 52-week lows today, compared with 52 new highs and 828 new lows in the previous trading session.
The ratio of new 52-week highs to new 52-week lows declined further:
- Today’s ratio was approximately 0.04, or 4%.
- Yesterday’s ratio was approximately 0.06, or 6%.
This represents a further deterioration in the relationship between stocks reaching new highs and those falling to new lows.
Although the number of new 52-week lows decreased from yesterday, the number of new highs also declined significantly. The resulting high-to-low ratio confirms that the overall internal condition of the NASDAQ remains weak.
The combination of negative market breadth and an extremely low new-high-to-new-low ratio suggests that the NASDAQ continues to struggle beneath the surface.
Trading Volume: Total NASDAQ trading volume reached 10,248,436,949 shares today, approximately 6% higher than the 9,634,715,266 shares traded during the previous session.
The increase in trading volume, alongside negative market breadth, is another development worth monitoring. However, higher volume alone does not establish whether selling pressure is nearing exhaustion or whether further weakness lies ahead.
NASDAQ Market Assessment and Investment Strategy: The focus for our readers, investors, and traders should remain on protecting capital while gradually building and updating their investment watchlists.
Given the current condition of the market’s internal indicators and the broader technical picture, we continue to suggest that retail investors consider limiting their market exposure to no more than approximately 30% of total portfolio value at this stage.
Investors and traders should also remain flexible and prepared to adjust their positions when market conditions change or when the market moves against their expectations.
Financial markets are dynamic and constantly changing. The current bearish trend will eventually reverse, whether in the near term or at a later date. Naturally, investors would prefer a quick reversal of the prevailing bearish trend and a longer-lasting continuation of a bullish market environment.
However, anticipating a reversal is different from confirming one. Traders should avoid committing aggressively to new positions until the market demonstrates convincing signs of improving breadth, stronger internal indicators, and a technically established recovery.
Overall NASDAQ Outlook
The NASDAQ continues to struggle, and its internal market indicators need to improve considerably before a more constructive outlook can be established.
Given the present condition of the market, patience will be essential. Investors and traders should resist the temptation to become overly aggressive simply because individual stocks may appear attractive following recent declines.
The market will ultimately determine its own direction. Our responsibility as investors and traders is to monitor its behaviour, study the available indicators, and respond accordingly.
For now, capital preservation, disciplined risk management, and patience should take precedence over aggressive trading.
The current market conditions do not yet provide sufficient evidence to justify very aggressive trading.
.
Tuesday’s US Market Wrap-Up Report
Treasury Market and Overall Market Performance: The 10-year US Treasury yield slipped by nearly 2 basis points to 5.10% today.
All four major US market indexes that we track closed well below their respective session highs, reflecting continued selling pressure and an inability to sustain intraday recoveries. Technology stocks were among the leading contributors to today’s market weakness.
Sector Performance
Commercial Services was the strongest-performing sector today, gaining 9.92%. The sector has also been among the better-performing areas of the market over the past four sessions.
Other sectors recording notable gains included Health Technology, Communications, Utilities, and Transportation, which advanced 7.77%, 6.87%, 6.45%, and 5.14%, respectively.
Retail Trade gained 2.33%, while Technology Services advanced 2.23%.
On the weaker side, Distribution Services declined 8.43%, Energy Minerals fell 10.19%, Non-Energy Minerals slumped 11.10%, and Electronic Technology dropped 12.75%, making it the weakest-performing sector of the session.
The substantial decline in Electronic Technology highlights the continuing pressure affecting several areas of the technology market.
Optoelectronics and Semiconductor Stocks
Optoelectronics stocks showed renewed strength today and performed better than they had on most trading days last week.
Coherent Corp. (COHR) advanced 3.65%, while Lumentum Holdings (LITE) gained 2.56%. Corning Inc. (GLW) also performed well, rising 2.19% to close at $108.49, with approximately 10.4 million shares traded.
Semiconductor stocks displayed some signs of recovery. However, many stocks within the semiconductor industry group have experienced considerable technical damage to their charts. Rebuilding those chart patterns and restoring positive technical momentum could take time.
Investors should therefore distinguish between short-term price recoveries and genuine improvements in the underlying technical condition of these stocks.
Major Semiconductor and Technology Stocks
Nvidia attracted considerable attention today. The stock recovered from its session low as news circulated concerning its board and Jensen Huang. This news and the circumstances surrounding it should be independently verified before publication.
Other semiconductor-related stocks recorded mixed performances:
- Astera Labs Inc. (ALAB): Advanced 4.58% to close at $211.60, with approximately 5.2 million shares traded.
- Arm Holdings plc (ARM): Gained 4.76% to close at $183.39, with approximately 6.3 million shares traded.
- Advanced Micro Devices (AMD): Declined 0.17%, with approximately 36.3 million shares traded.
- Tower Semiconductor (TSEM): Advanced 1.98%, with approximately 3 million shares traded.
- Intel Corp. (INTC): Declined 0.54%, with relatively heavy trading volume of approximately 104.6 million shares.
Although several semiconductor stocks recorded gains, the industry’s overall technical condition remains a concern. A few positive sessions should not automatically be interpreted as confirmation that the group has entered a sustained recovery.
Major Technology Companies: Among the large-cap technology companies, Apple Inc. (AAPL) declined 0.25%, with approximately 37.4 million shares traded.
Apple is a stock worth keeping under observation and potentially adding to an investment watchlist. Its chart continues to display relatively constructive technical characteristics compared with many other technology stocks.
Investors should continue to monitor Apple’s price action and its ability to maintain its technical strength during the current market weakness.
DELL Technologies (DELL) gained 0.70%, with approximately 7.3 million shares traded. In contrast, International Business Machines (IBM) declined considerably, falling 4.71%, with approximately 4.9 million shares traded.
Retail Stocks
Retail stocks also experienced weakness during today’s session, with several companies finishing lower.
- Etsy Inc. (ETSY): Declined 2.80%, with approximately 3 million shares traded.
- Victoria’s Secret (VSXY): Fell 3.09%, with approximately 1.3 million shares traded.
- SharkNinja Inc. (SN): Declined 1.42%, with approximately 1.2 million shares traded.
The weakness among these retail stocks reflects the uneven performance across individual industry groups and reinforces the importance of evaluating stocks individually rather than relying solely on broader sector movements.
Overall Market Assessment
Today’s session produced a mixed picture beneath the broader market weakness. Optoelectronics and selected semiconductor stocks showed signs of recovery, while several other technology companies and retail stocks continued to struggle.
Commercial Services was the strongest-performing sector, whereas Electronic Technology was the session’s weakest performer.
Of particular importance is the continuing technical deterioration affecting many semiconductor stocks. Although some individual companies are beginning to show signs of stabilization, investors should remain patient and avoid assuming that short-term rebounds represent a confirmed change in trend.
Apple remains worth monitoring because of its comparatively constructive chart, while the broader technology and semiconductor groups still require time to demonstrate meaningful technical improvement.
Investment Outlook: Investors and traders should continue to emphasize capital preservation, maintain disciplined market exposure, and concentrate on building quality watchlists. Selective opportunities may emerge even during periods of broad market weakness, but patience and technical confirmation should guide decisions before committing significant additional capital.