






Major Indexes Plunge as Early Market Rally Reverses Amid Heavy Late-Session Selling
The Canadian Vanguard Stock Market Report – Thursday November 19, 2026 Edition
.
The Toronto Market
Thursday’s Toronto Market Index
The S&P/TSX Composite Index declined 549.32 points, or 1.59%, to close at 34,028.73.
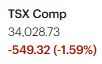

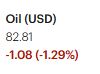
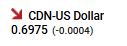
The Toronto market has now recorded five consecutive sessions of declines. Although AI-related developments and concerns have generally influenced market sentiment, the impact on the TSX has been relatively less pronounced than on the U.S. markets. This is largely because the TSX has relatively few large-cap technology stocks and is more heavily weighted toward the financial, energy, and precious metals sectors. Nevertheless, the Toronto market is not entirely immune to the negative effects of U.S. market reactions to developments and concerns surrounding artificial intelligence.
Market breadth was negative again today, marking the fourth consecutive session of negative breadth. This persistent weakness suggests that selling pressure remains widespread across the market.
Traders and investors should continue to prioritize capital preservation by maintaining adequate risk-management measures and disciplined trading guidelines. One suggestion is to limit market exposure to approximately 10%–15% of total portfolio value for the time being. This conservative approach may help reduce potential losses while awaiting clearer evidence of a confirmed market turnaround.
Technically, the TSX Composite Index closed below its 21-day, 50-day, and 200-day moving averages. The index has deteriorated considerably over the past several weeks, reflecting a weakening technical outlook. The risk to traders and investors has also increased, particularly following the index’s move below its 50-day moving average.
Until the market establishes a credible and sustained recovery, caution and capital preservation should remain the primary priorities.
Thursday’s TSX Market Statistics
At the Toronto Stock Exchange (TSX), declining issues (decliners) significantly outnumbered advancing issues (advancers). Specifically, there were 1,971 decliners and 360 advancers, producing a decliner-to-advancer ratio of approximately 5.47 to 1. In other words, there were nearly eleven declining stocks for every two advancing stocks. An additional 279 issues remained unchanged. These figures reflect very negative market breadth and indicate widespread selling pressure.
The exchange recorded 16 new 52-week highs and 307 new 52-week lows today, compared with 20 new 52-week highs and 247 new 52-week lows yesterday.
The number of new 52-week highs declined by 20% compared with yesterday. Furthermore, the ratio of new 52-week highs to new 52-week lows deteriorated to approximately 5% today, compared with 13% yesterday. This means that for every 100 stocks making new 52-week lows, only about five stocks recorded new 52-week highs today, compared with approximately 13 yesterday.
The number of stocks recording new 52-week lows substantially exceeded those reaching new highs on both days. Overall, these figures indicate that the market’s internal condition remains weak and has continued to deteriorate over recent trading sessions.
Total trading volume on the TSX reached 592,265,069 shares today, representing a decrease of approximately 1.5% from yesterday’s volume of 600,426,999 shares.
Investors and traders should continue monitoring the market’s internal statistics closely. These indicators can provide valuable early clues about potential changes in market direction and help identify the initial stages of a possible turnaround.
However, readers are reminded that recognizing a potential market bottom is not the same as confirming a market recovery. It is generally prudent to wait for convincing evidence of a sustained turnaround and the establishment of a new uptrend before committing significant capital to new positions or undertaking major trades.
Thursday’s TSX Market Wrap-Up Report
Market Weakness Deepens as Selling Pressure Remains Widespread
1. Market Performance and Technical Outlook
The S&P/TSX Composite Index declined 549.32 points, or 1.59%, to close at 34,028.73. This marks the fifth consecutive trading session of losses, highlighting the continued deterioration in the Toronto market.
The weakness in the TSX should be viewed within the broader context of the recent negative sentiment affecting U.S. markets, particularly concerns surrounding artificial intelligence (AI) developments and their potential implications for technology stocks and corporate valuations.
However, the impact on the TSX has generally been less pronounced than on U.S. markets. This is partly because the Toronto market has relatively few large-cap technology stocks and is more heavily weighted toward financial services, energy, and precious metals. Nevertheless, the TSX is not entirely insulated from negative developments and changes in investor sentiment south of the border.
From a technical perspective, the TSX Composite Index closed below its 21-day, 50-day, and 200-day moving averages. This is a significant deterioration in its technical condition and suggests that the market’s downward momentum remains firmly established.
Of particular concern is the index’s position below its 50-day moving average, which represents an important intermediate-term technical reference point. The additional close below the 200-day moving average also raises concerns about the market’s longer-term technical outlook.
Until the index can recover these important moving averages and demonstrate sustained upward momentum, traders and investors should remain cautious.
2. Market Breadth: Selling Pressure Remains Widespread
Market breadth was extremely negative today, with declining issues substantially outnumbering advancing issues.
Specifically, the TSX recorded:
- Declining issues: 1,971
- Advancing issues: 360
- Unchanged issues: 279
This produced a decliner-to-advancer ratio of approximately 5.47 to 1. In practical terms, there were nearly eleven declining stocks for every two advancing stocks.
Of additional concern, market breadth has now been negative for four consecutive trading sessions. This persistent imbalance indicates that selling pressure is not limited to a small number of heavily weighted stocks but is affecting a substantial portion of the broader market.
The continued deterioration in market breadth is an important warning sign that investors and traders should not ignore.
3. New 52-Week Highs and Lows: Market Internals Continue to Deteriorate
The TSX recorded 16 new 52-week highs and 307 new 52-week lows today, compared with 20 new highs and 247 new lows yesterday.
The number of new 52-week highs declined by 20% from yesterday, while the number of new 52-week lows increased by approximately 24.3%.
Another useful way to assess this data is to compare new highs with new lows.
Today, the ratio of new 52-week highs to new 52-week lows was approximately 0.05, or 5%. Yesterday, the corresponding ratio was approximately 0.08, or 8%.
In other words, for every 100 stocks recording new 52-week lows today, only about five stocks reached new 52-week highs.
This is a considerable imbalance and provides further evidence of deteriorating market conditions.
The fact that new 52-week lows substantially outnumbered new highs on both days suggests that the underlying weakness extends beyond the performance of the TSX Composite Index itself.
Taken together, the negative market breadth and the growing number of stocks recording new 52-week lows indicate that the market’s internal condition remains weak and warrants continued caution.
4. Trading Volume
Total trading volume on the TSX reached 592,265,069 shares today, representing a decrease of approximately 1.5% from yesterday’s volume of 600,426,999 shares.
Although trading volume declined slightly, the decrease does not materially change the overall interpretation of today’s market activity. The more significant concern remains the widespread weakness reflected in market breadth and the substantial imbalance between new 52-week highs and lows.
Investors and traders should continue monitoring both price movements and trading volume to determine whether selling pressure is intensifying, stabilizing, or beginning to subside.
5. Key Takeaways for Traders and Investors
The TSX is currently displaying several negative market characteristics that deserve close attention:
- Five consecutive sessions of declines: The market has experienced sustained selling pressure, with the latest decline bringing the index to 34,028.73.
- Negative technical positioning: The index is trading below its 21-day, 50-day, and 200-day moving averages. This reflects a deteriorating technical outlook across the short-, intermediate-, and longer-term reference periods.
- Persistently negative market breadth: Decliners outnumbered advancers by approximately 5.47 to 1, marking the fourth consecutive session of negative market breadth.
- Deteriorating market internals: New 52-week lows substantially exceeded new highs, with the imbalance becoming more pronounced compared with yesterday.
- Increased investment risk: The combination of declining prices, weak market breadth, and deteriorating technical indicators suggests that the risk of entering new positions prematurely has increased.
Recommended Approach: Capital Preservation and Risk Management
Given the current market environment, capital preservation should remain the primary consideration for both traders and investors.
One conservative approach worth considering is to limit overall market exposure temporarily to approximately 10%–15% of total portfolio value, depending on individual risk tolerance, investment objectives, and existing portfolio commitments.
Traders should be particularly selective when considering new positions and avoid committing significant capital simply because individual stocks appear oversold or have experienced substantial price declines.
Investors with longer-term horizons should also review their portfolio exposure, reassess risk levels, and ensure that their holdings remain consistent with their investment objectives.
Most importantly, traders and investors should resist the temptation to anticipate a market bottom. A decline of this magnitude may eventually create attractive opportunities, but a potential bottom is not the same as a confirmed market turnaround.
Before substantially increasing market exposure, look for convincing evidence of improvement, including:
- The TSX Composite Index stabilizing and recovering important moving averages.
- Market breadth improving, with advancing issues consistently outnumbering declining issues.
- The number of new 52-week highs increasing while new 52-week lows begin to decline.
- Sustained improvement in trading activity accompanying upward price movements.
Final Perspective
The Toronto market remains under considerable pressure, and the latest market statistics do not yet provide convincing evidence that a sustainable recovery is underway.
The combination of five consecutive sessions of declines, four consecutive sessions of negative market breadth, a substantial excess of new 52-week lows over new highs, and the TSX’s position below all three important moving averages calls for continued caution.
For now, protecting capital is more important than pursuing aggressive market opportunities. There will be opportunities to increase market exposure when the technical indicators and underlying market statistics begin to confirm a meaningful and sustainable improvement.
Remember: Preserving capital during periods of market weakness puts traders and investors in a better position to take advantage of opportunities when a confirmed market uptrend eventually emerges.
.
The US Markets
Thursday’s U.S. Market Indexes
Broad-Based Market Sell-Off Sends All Four Major Indexes Down More Than 2%
1. Major U.S. Market Indexes Suffer Significant Losses
The major U.S. stock market indexes ended Thursday’s trading session deep in negative territory, recording substantial losses across the board.
The Dow Jones Industrial Average slumped 1,101.11 points, or 2.19%, to close at 49,097.06.
The S&P 500 declined 147.80 points, or 2.02%, finishing the session at 7,175.83.
The Nasdaq Composite plunged 550.69 points, or 2.25%, to close at 23,879.20.
The Russell 2000 Index also suffered a significant decline, falling 59.20 points, or 2.18%, to finish at 2,655.11.
All four major indexes lost more than 2% during today’s session. This was a particularly damaging trading day for the U.S. equity market, as selling pressure affected the market broadly rather than being concentrated in any one major index or market-capitalization category.
Under today’s circumstances, debating which index was the relative outperformer has become largely irrelevant. The more important observation is that the market experienced a broad-based sell-off, with both large-cap and small-cap stocks participating in the decline.
The simultaneous weakness across the Dow Jones, S&P 500, Nasdaq Composite, and Russell 2000 suggests that today’s selling pressure was widespread and not confined to the technology sector.
2. Intraday Market Behaviour: An Attempted Recovery Fails
The four major indexes followed remarkably similar trading patterns throughout the session.
They initially opened higher but subsequently encountered substantial selling pressure and declined sharply. Although the indexes attempted to reverse their losses and recover some ground, the recovery proved unsuccessful.
Around midday, the market changed direction again, with selling pressure returning and pushing all four indexes into negative territory. The weakness persisted into the close.
This intraday pattern is worth noting. The inability of the indexes to sustain their initial recovery attempts suggests that buyers were unable to overcome the prevailing selling pressure.
For traders, failed recovery attempts and renewed selling toward the close are developments that warrant attention, particularly when they occur across all the major market indexes.
3. Technical Outlook: All Four Major Indexes Remain Below Important Moving Averages
The technical condition of the major U.S. market indexes has deteriorated considerably. All four indexes are trading below their respective 21-day and 50-day moving averages, indicating significant weakness in their short- and intermediate-term technical conditions.
The position of each index relative to its longer-term 200-day moving average also deserves close attention.
Dow Jones Industrial Average: The Dow Jones closed at 49,097.06, substantially below its 21-day, 50-day, and 200-day moving averages.
Its position below all three moving averages is a significant technical concern and suggests that the index is experiencing weakness across multiple time horizons.
Nasdaq Composite: The Nasdaq Composite closed at 23,879.20, below its 21-day, 50-day, and 200-day moving averages.
The index’s position below these important technical reference points is particularly concerning. The separation between the index and its moving averages indicates that its technical condition requires considerable improvement.
The Nasdaq chart needs repairs before traders can have greater confidence in a sustainable recovery. Until the index can stabilize, regain important moving averages, and demonstrate sustained upward momentum, caution remains warranted.
S&P 500: The S&P 500 closed at 7,175.83, slightly below its 21-day and 50-day moving averages. It also finished marginally below its 200-day moving average.
Although the index is relatively close to these important technical levels, closing below all three is nevertheless a negative development.
Traders should monitor whether the S&P 500 can quickly recover these moving averages or whether further selling pressure will push the index farther below them.
Russell 2000: The Russell 2000 declined to 2,655.11 and remains below its 21-day and 50-day moving averages.
However, the index closed closer to its 200-day moving average, making this an important technical level to monitor.
Whether the Russell 2000 can stabilize around its 200-day moving average or eventually moves decisively below it could provide additional insight into the condition of small-cap stocks and broader market sentiment.
4. Key Takeaways for Traders and Investors
Thursday’s trading session delivered several important warning signals that traders and investors should not overlook.
- Broad-based selling pressure: All four major U.S. indexes declined by more than 2%. The weakness affected both large-cap and small-cap stocks, suggesting that today’s sell-off was widespread.
- Failed recovery attempts: The indexes initially opened higher, but buyers were unable to sustain the recovery. Renewed selling pressure eventually pushed all four indexes lower into the close.
- Deteriorating technical conditions: All four major indexes are below their 21-day and 50-day moving averages. The Dow Jones, Nasdaq, and S&P 500 are also below their 200-day moving averages.
- Nasdaq requires particular attention: Its position below all three moving averages highlights the extent of its technical deterioration. A meaningful recovery will require more than an isolated bounce.
- Small-cap stocks are also under pressure: The Russell 2000’s decline confirms that the weakness is not limited to large-cap technology and other heavily weighted stocks.
Recommended Strategy: Exercise Caution and Protect Capital
Given the magnitude and breadth of today’s decline, traders and investors should exercise considerable caution when considering new market positions.
This is not an ideal environment for aggressive buying or committing substantial amounts of capital simply because stocks have become cheaper following the sell-off.
Traders should remain selective, reduce unnecessary exposure where appropriate, and pay particular attention to risk-management guidelines and stop-loss discipline.
Investors should also reassess their portfolio exposure and ensure that their holdings remain consistent with their individual risk tolerance and investment objectives.
Most importantly, avoid assuming that one or two sessions of recovery will automatically signal the beginning of a new uptrend.
A more convincing recovery would require sustained improvement in price action, the ability of the major indexes to reclaim important moving averages, and broader participation from advancing stocks.
Final Perspective
Thursday’s U.S. market session was a particularly damaging one. The simultaneous declines across the Dow Jones, S&P 500, Nasdaq Composite, and Russell 2000 demonstrate the extent of the selling pressure affecting the broader equity market.
The technical condition of the indexes has also deteriorated, with all four trading below their short- and intermediate-term moving averages and three of the four below their respective 200-day moving averages.
For now, traders and investors should place greater emphasis on capital preservation than on aggressively pursuing market opportunities.
The market will eventually present new opportunities, but patience is essential. Wait for meaningful technical improvement and confirmation of a sustainable market turnaround before substantially increasing market exposure.
Remember: In a market environment characterized by widespread selling pressure and deteriorating technical conditions, protecting capital is a trading and investment strategy in itself.
.
Thursday’s U.S. Market Statistics
Market Internals Deteriorate Further as Selling Pressure Intensifies
1. New York Stock Exchange (NYSE)
Market Breadth: Six Consecutive Sessions of Negative Breadth
Declining issues (decliners) significantly outnumbered advancing issues (advancers) on the New York Stock Exchange today.
Specifically, the NYSE recorded:
- Declining issues: 2,228
- Advancing issues: 480
- Unchanged issues: 90
This produced a decliner-to-advancer ratio of approximately 4.64 to 1. In other words, there were nearly nine declining stocks for every two advancing stocks.
Market breadth was significantly negative today, marking the sixth consecutive trading session in which declining issues outnumbered advancing issues.
This persistent imbalance is a clear indication that selling pressure remains widespread across the exchange. The continued negative breadth also suggests that the underlying condition of the market has not improved.
New 52-Week Highs and Lows: Further Deterioration
The NYSE recorded 15 new 52-week highs and 461 new 52-week lows today, compared with 29 new highs and 388 new lows yesterday.
The number of new 52-week highs declined by approximately 48% compared with yesterday, while the number of new 52-week lows increased by approximately 19%.
Another useful way to evaluate these statistics is to compare the number of new 52-week highs with the number of new 52-week lows.
Today’s new-high-to-new-low ratio was approximately 0.03, or 3.3%. Yesterday’s corresponding ratio was approximately 0.075, or 7.5%.
This means that for every 100 stocks recording new 52-week lows today, only about three stocks reached new 52-week highs.
The deterioration in this ratio is particularly concerning. It indicates that stocks recording new lows continue to substantially outnumber those reaching new highs.
Taken together, the negative market breadth and deteriorating new-high-to-new-low ratio provide further evidence that the NYSE’s internal condition remains very weak.
Trading Volume
Total trading volume on the NYSE reached 5,259,113,529 shares today, approximately 0.7% lower than yesterday’s volume of 5,295,727,910 shares.
Although trading volume declined slightly, the overall market statistics continue to reflect considerable weakness.
NYSE Assessment
The NYSE’s internal indicators weakened further today. Six consecutive sessions of negative market breadth, combined with the substantial imbalance between new 52-week highs and lows, provide little evidence of an improving market environment.
The market’s internal condition remains unfavorable, and there is presently little reason to assume that a sustainable recovery is imminent.
For traders and investors, these developments reinforce the need for caution. Market risk remains elevated, and capital preservation should continue to be a priority.
2. NASDAQ Market Statistics
Market Breadth: Five Consecutive Sessions of Negative Breadth
The NASDAQ experienced another session of negative market breadth today, with declining stocks substantially outnumbering advancing stocks.
The exchange recorded:
- Declining issues: 3,860
- Advancing issues: 1,076
- Unchanged issues: 225
The resulting decliner-to-advancer ratio was approximately 3.59 to 1. In practical terms, there were nearly seven declining stocks for every two advancing stocks.
Today’s negative market breadth marks the fifth consecutive trading session in which declining stocks have outnumbered advancing stocks on the NASDAQ.
This continued imbalance indicates that selling pressure remains widespread across NASDAQ-listed stocks.
New 52-Week Highs and Lows: Market Internals Deteriorate Further
The NASDAQ recorded 45 new 52-week highs and 799 new 52-week lows today, compared with 65 new highs and 710 new lows yesterday.
The number of new 52-week highs declined by approximately 31% compared with yesterday, while the number of new 52-week lows increased by approximately 13%.
A comparison of new 52-week highs with new 52-week lows provides another important perspective on the market’s underlying condition.
Today’s new-high-to-new-low ratio was approximately 0.056, or 5.6%, compared with approximately 0.09, or 9.2%, yesterday.
In other words, for every 100 stocks recording new 52-week lows today, only about six stocks reached new 52-week highs.
This represents a further deterioration in the market’s internal condition.
Although the NASDAQ recorded more new 52-week highs than the NYSE, the number of stocks reaching new lows remained overwhelmingly higher.
The combination of negative market breadth and a deteriorating new-high-to-new-low ratio suggests that the NASDAQ’s internal condition remains weak and that the risks facing traders and investors are still elevated.
Trading Volume: Significant Increase in Trading Activity
Total NASDAQ trading volume reached 10,917,050,887 shares today, representing an increase of approximately 27.2% compared with yesterday’s volume of 8,578,741,129 shares.
This substantial increase in trading volume, occurring alongside another session of negative market breadth and significant declines in the major market indexes, deserves particular attention.
Sellers appeared to maintain control of the market throughout the session. The combination of increased trading activity and widespread stock declines suggests that the selling pressure remains substantial.
However, increased volume alone does not establish whether selling pressure is approaching exhaustion. Traders should continue monitoring subsequent price action and market breadth for evidence of stabilization or further deterioration.
NASDAQ Assessment
The NASDAQ continues to struggle, and its technical condition remains a major concern.
As discussed in our U.S. Market Indexes report, the Nasdaq Composite closed below its 21-day, 50-day, and 200-day moving averages. This reflects considerable technical deterioration across short-, intermediate-, and longer-term reference periods.
The weakness in the NASDAQ’s market internals provides additional confirmation that the problem extends beyond the performance of the index itself.
The market’s internal indicators badly need to improve before traders and investors can have greater confidence in a sustainable recovery.
That improvement will eventually come, but nobody knows when.
The market will always do what it wishes to do. Investors and traders must therefore continuously monitor changing market conditions and respond appropriately rather than attempting to predict or dictate the market’s direction.
3. Key Takeaways for Traders and Investors
Thursday’s NYSE and NASDAQ statistics provide several important warning signals that should not be overlooked.
3.1. Market breadth remains persistently negative.
The NYSE has recorded six consecutive sessions of negative market breadth, while the NASDAQ has recorded five consecutive sessions.
This persistent weakness indicates that selling pressure remains widespread across the U.S. equity market.
3.2. Market internals have deteriorated further.
Both exchanges recorded substantially more new 52-week lows than new highs.
The NYSE’s new-high-to-new-low ratio deteriorated from approximately 7.5% yesterday to 3.3% today.
The NASDAQ’s corresponding ratio declined from approximately 9.2% yesterday to 5.6% today.
These figures indicate that the underlying condition of the market remains weak.
3.3. Increased NASDAQ volume deserves attention.
NASDAQ trading volume increased approximately 27.2% today while the market experienced another broad-based decline.
This combination suggests substantial trading activity amid widespread weakness. Traders should watch subsequent sessions to determine whether selling pressure continues or begins to subside.
3.4. Capital preservation should take priority over aggressive buying.
This is not an attractive environment for indiscriminately establishing new positions or committing substantial capital to the market.
Traders should remain selective, maintain disciplined risk-management practices, and avoid unnecessary exposure.
For investors whose circumstances and risk tolerance warrant it, maintaining a substantially reduced market exposure or even a 100% cash position may be a reasonable defensive strategy at this stage.
Being in cash is not necessarily a missed opportunity. It provides flexibility and preserves capital for more favorable market conditions.
3.5. Continue building and monitoring a watchlist.
Periods of market weakness can provide opportunities to identify potentially attractive stocks for future investment.
Rather than rushing into positions, traders and investors should use this time to identify quality companies, establish potential entry levels, and monitor their technical conditions.
A carefully developed watchlist can be particularly valuable when market conditions eventually improve.
4. Final Perspective: Protect Capital and Wait for Confirmation
The latest NYSE and NASDAQ statistics do not provide convincing evidence of an improving market environment.
The combination of persistently negative market breadth, deteriorating new-high-to-new-low ratios, and unfavorable technical conditions indicates that market risk remains elevated.
The NYSE and NASDAQ both need substantial improvement in their internal indicators before a sustainable market recovery can be established.
For now, traders and investors should resist the temptation to anticipate a market bottom. A decline in stock prices does not automatically make stocks attractive buying opportunities.
The more prudent approach is to protect capital, maintain an appropriate level of cash, continue developing a watchlist, and patiently monitor the market for evidence of a genuine turnaround.
The objective is not to predict the exact bottom of the market. It is to recognize when the market has begun to improve and position ourselves accordingly.
Capital preservation today can provide the financial flexibility and confidence needed to participate in tomorrow’s opportunities.
Thursday’s U.S. Market Wrap-Up Report
Technology-Led Sell-Off Reverses Early Gains as Market Risk Increases
1. Market Overview: A Broad-Based Sell-Off
Thursday was another deeply disappointing session for the U.S. stock market. All four major market indexes ended the session firmly in negative territory, with declines exceeding 2% across the board.
The Dow Jones Industrial Average declined 1,101.11 points, or 2.19%, to close at 49,097.06.
The S&P 500 fell 147.80 points, or 2.02%, finishing at 7,175.83.
The Nasdaq Composite plunged 550.69 points, or 2.25%, to close at 23,879.20.
The Russell 2000 declined 59.20 points, or 2.18%, finishing at 2,655.11.
Today’s trading reflected a broad shift toward risk aversion. Selling pressure affected both large-cap and small-cap stocks, with technology shares among the major contributors to the market’s weakness.
The market’s inability to sustain its initial gains was particularly concerning. Despite an initially positive opening, sellers eventually took control, pushing the major indexes sharply lower and keeping them under pressure through the close.
U.S. Treasury yields also declined. The 10-year Treasury yield fell approximately 1.8 basis points to 5.05%, reflecting a move toward greater caution among investors.
2. Sector Performance: Technology and Materials Under Pressure
Sector performance was mixed, although the overall market environment remained negative.
According to the sector performance figures provided, Consumer Services led the gainers, advancing 4.23%. Utilities rose 3.13%, while Health Technology gained 2.25%.
Retail Trade advanced 0.87%, and Finance edged higher by 0.08%.
On the downside, Non-Energy Minerals was the weakest group, declining 14.92%. Electronic Technology fell 13.51%, while Energy Minerals declined 12.24%.
The weakness in technology-related stocks was particularly important because of the sector’s influence on the broader U.S. equity market.
The substantial divergence between the advancing and declining groups also illustrates why investors should examine individual sector performance rather than relying exclusively on the movements of the major indexes.
3. Technology Stocks: An Early Rally Turns Into a Sharp Reversal
Technology stocks initially opened on a positive note and advanced sharply, partly reflecting enthusiasm surrounding Anthropic’s highly anticipated Nasdaq IPO debut.
However, the early optimism did not last. By midday, technology shares had reversed direction, surrendered their initial gains, and moved sharply lower.
One important development contributing to the weakness was a report published by short seller Hunterbrook Media concerning Advanced Micro Devices (AMD).
The report alleged that newer versions of AMD’s firmware had continued to appear in products associated with IEIT Systems, a Chinese server manufacturer that was placed on the U.S. Commerce Department’s Entity List.
The allegations raised questions about potential regulatory and export-control implications for AMD.
AMD shares subsequently came under substantial selling pressure, declining approximately 8% and becoming one of the weaker performers among major technology stocks.
It is important to recognize that these were allegations made by a short seller, rather than established findings of regulatory wrongdoing. Nevertheless, the report introduced another source of uncertainty for investors already concerned about technology-sector valuations and AI-related developments. <Cite refs={[“turn242086search4″,”turn242086search11”]}/>
The broader technology sell-off also demonstrated how quickly positive market sentiment can reverse when investors become concerned about valuations, regulatory exposure, and the sustainability of the AI investment boom.
4. Company News and Individual Stock Developments
Anthropic (NASDAQ: ANT): A Record-Breaking IPO Debut
One of Thursday’s biggest corporate stories was the public market debut of Anthropic, the developer of the Claude AI chatbot.
Anthropic priced its initial public offering at $83 per share and opened trading on the Nasdaq at $111.50, representing an increase of approximately 34% over its IPO price.
The shares initially attracted considerable buying interest, briefly pushing the company’s valuation above $2 trillion.
However, the stock subsequently surrendered some of its early gains and closed at $97.17, still approximately 17% above its IPO price.
The listing represented the largest IPO in history and placed Anthropic among the world’s most highly valued companies.
The impressive debut notwithstanding, the stock’s intraday reversal was worth watching. It demonstrated that even extraordinary enthusiasm surrounding an IPO could not prevent a broader deterioration in market sentiment.
Sanofi (NASDAQ: SNY) and Insmed (NASDAQ: INSM): Potential Acquisition News
Another significant corporate development involved French pharmaceutical company Sanofi, which Bloomberg reported was considering the acquisition of U.S. drug maker Insmed.
The potential transaction attracted considerable attention from investors.
Sanofi shares declined approximately 2.4%, while Insmed shares advanced sharply following the news.
It is important to emphasize that the discussions remain preliminary. There is no guarantee that a transaction will ultimately materialize, and any potential agreement could still be weeks away.
Nevertheless, the possibility of a major pharmaceutical acquisition provided one of the relatively positive corporate developments during an otherwise difficult trading session.
Bloom Energy (NYSE: BE): BMO Capital Upgrades Its Rating
Bloom Energy attracted attention after BMO Capital Markets upgraded its rating on the fuel-cell energy provider from Market Perform to Outperform.
The upgrade followed discussions with Bloom Energy management and reflected increased confidence in the company’s commercial execution and growth opportunities, particularly in supplying power infrastructure for AI data centers.
BMO highlighted evidence of execution in Bloom’s commercial projects and its potential to benefit from continued demand for reliable electricity to support expanding AI infrastructure.
Some of Bloom Energy’s notable customers and commercial relationships include Nebius Group (NBIS) and Oracle Corporation (ORCL).
The upgrade is particularly interesting because Bloom Energy has experienced considerable share-price volatility.
The stock reached nearly $300 in early October before retreating significantly.
Despite the positive analyst development, Bloom Energy shares closed Thursday at $168.06, down 1.71%, with approximately 16.6 million shares traded.
In my view, Bloom Energy is worth keeping on the radar. Its exposure to AI-related electricity demand makes it an interesting company to monitor, particularly as data-center infrastructure investment continues to evolve.
However, its substantial previous price appreciation and subsequent correction are reminders that an attractive business opportunity does not automatically translate into an attractive stock entry point.
For now, I would consider adding BE to a watchlist and monitoring its technical recovery rather than rushing into a new position simply because of the analyst upgrade.
Cybersecurity Stocks: Palo Alto Networks Leads the Advance
Cybersecurity stocks were among the stronger performers on Thursday, extending a positive trend that has attracted attention during the week.
Palo Alto Networks (NASDAQ: PANW) advanced 6.42%, closing at $361.73, with approximately 19.2 million shares traded.
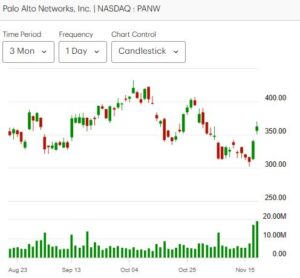
The company’s strong performance was supported by its latest financial results and an improved annual sales outlook. Its positive outlook reinforced investor expectations that businesses will continue increasing their cybersecurity spending as digital threats become more sophisticated, particularly with the growing adoption of artificial intelligence.
Palo Alto’s improved outlook also helped lift other cybersecurity companies, including CrowdStrike, Zscaler, and Fortinet.
The cybersecurity industry remains an interesting area to monitor because the need to protect corporate systems, networks, and digital infrastructure continues to grow.
For traders and investors, PANW deserves a place on the watchlist. However, its strong performance on an otherwise weak market day should not automatically be interpreted as a broad market recovery signal.
5. Market Posture Evaluation: Risk Remains Elevated
Thursday’s trading session reinforced the concerns surrounding the current condition of the U.S. stock market.
Several developments deserve particular attention:
All four major indexes declined by more than 2%.
- Technology stocks experienced a significant reversal after initially opening higher.
- Selling pressure affected both large-cap and small-cap stocks.
- The major indexes remain below their 21-day, 50-day, and important longer-term moving averages.
- Market breadth and market internals remain weak, as discussed in our Thursday U.S. Market Statistics report.
The inability of the market to maintain its early gains is particularly concerning. Buyers had an opportunity to establish control during the initial part of the session but ultimately failed to sustain the advance.
Sellers were clearly in control by the close.
The combination of deteriorating technical conditions, weak market internals, and widespread selling pressure suggests that the current market environment continues to carry elevated risks for traders and investors.
6. Key Takeaways for Traders and Investors
1. Do not rush into the market.
The fact that stocks have declined substantially does not automatically make them attractive buying opportunities. Oversold conditions can persist, and prices can continue declining.
2. Give capital preservation priority.
Traders and investors should seriously consider reducing their market exposure. Depending on individual circumstances and risk tolerance, remaining entirely in cash may be a reasonable defensive strategy at this stage.
3. Be selective with individual stocks.
There will always be individual companies performing well, even during a market decline. However, strong individual performance should not be confused with confirmation of a broader market recovery.
4. Continue building a watchlist.
Companies such as Bloom Energy and Palo Alto Networks are worth monitoring for potential opportunities. Use this period to identify promising companies, evaluate their technical conditions, and establish potential entry levels.
5. Wait for confirmation of a market turnaround.
Before substantially increasing market exposure, look for sustained improvement in the major indexes, recovering moving averages, improving market breadth, and a healthier balance between new 52-week highs and lows.
7. Final Perspective: Cash Is Also a Position
The U.S. stock market continues to display characteristics of a high-risk trading environment.
Thursday’s broad-based sell-off, particularly the weakness in technology stocks, reinforces the importance of maintaining a disciplined approach to risk management.
At this point, I believe traders and investors should seriously consider staying in cash until the current negative market trend begins to reverse and a more convincing recovery becomes evident.
There is no requirement to participate in every market movement. Sometimes, the most appropriate investment decision is to remain on the sidelines.
Cash provides flexibility, reduces exposure to further market declines, and allows investors to take advantage of opportunities when conditions become more favorable.
The market will eventually present new opportunities. However, nobody knows precisely when that will happen.
For now, protecting capital should take precedence over pursuing returns. Wait for the market to demonstrate that it is recovering before committing significant capital to new positions.
Remember: You do not have to catch the bottom to participate successfully in the next confirmed market uptrend.
.
NOTICE TO READERS
The Canadian Vanguard Stock Market is about empowering you to build and manage your wealth by yourself. There is certainly no magic in managing finances or wealth but one needs to know what to do and commit to doing what is needed. When you are ready to start the journey to Take Charge and Put Your Destiny In Your Own Hands, start with reading The Canadian Vanguard every market day. If and when you need more related information or to advertise your business products or services in The Canadian Vanguard, Contact Us
Our readers are strongly advised to conduct their own research into individual stocks before making a purchase decision. In addition, investors are advised that past stock performance is no guarantee of future price appreciation. Any recommendation is not a guarantee of any particular stock’s future prices, and The Canadian Vanguard accepts no responsibility or liability for investors’ or readers’ purchases.
The dollar sign “$” in the Toronto Market section in the articles only stands for Canadian dollar and in the US market section “$” stands for US dollar.
(c) This article is published by The Canadian Vanguard on November 19, 2026