

Stocks Retreat as Investors Reassess the Costs and Sustainability of the AI Boom
The Canadian Vanguard Stock Market Report Tuesday June 23, 2026 Edition
.
The Toronto Market
Tuesday’s Toronto Market Index
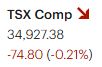
The S&P/TSX Composite Index declined 74.80 points (-0.21%) on Tuesday to close at 34,927.38. The index opened roughly 400 points below Monday’s close but recovered steadily throughout the session, finishing well above its intraday low, which was established at the market open.
Technically, the TSX remains comfortably above its 50-day and 200-day moving averages, while trading near its 25-day moving average. The index is currently about 600 points below its 52-week high, suggesting that recent weakness represents a normal pullback rather than a significant change in trend. Despite the recent consolidation, the TSX had been setting new highs on a frequent basis until recently.

![]()
Tuesday’s TSX Market Statistics
Market breadth on the TSX was negative on Tuesday, as declining issues outnumbered advancing issues. A total of 1,282 stocks declined, while 941 advanced, resulting in a decliner-to-advancer ratio of 1.36:1. In other words, there were approximately four decliners for every three advancers. An additional 135 issues closed unchanged.
The exchange recorded 90 new 52-week highs and 45 new 52-week lows, a notable decrease from the 226 new highs and 53 new lows posted on Monday. While new highs continued to outpace new lows by a two-to-one margin, the sharp decline in the number of stocks reaching new highs suggests some moderation in market momentum.
Trading activity increased modestly, with total TSX volume reaching 483.6 million shares, up 4% from the 466.1 million shares traded in the previous session.
Overall, the negative market breadth and reduced number of new highs indicate a softer underlying tone despite the relatively modest decline in the TSX Composite Index.
Tuesday’s TSX Toronto Market Wrap-Up Report
The S&P/TSX Composite Index declined 74.80 points (-0.21%) on Tuesday to close at 34,927.38. While the headline result was negative, the session’s underlying action was more constructive than the closing number suggests. The index opened approximately 400 points below Monday’s close but steadily recovered throughout the day, finishing well above its intraday low.
From a technical perspective, the TSX remains in a healthy intermediate-term uptrend. The index continues to trade comfortably above its 50-day and 200-day moving averages and is currently about 600 points below its 52-week high. The recent weakness appears to be a normal pullback following an extended advance that saw the TSX frequently establish new all-time highs.
Market breadth was negative as declining issues outnumbered advancing issues by 1,282 to 941, producing a decliner-to-advancer ratio of 1.36:1. Trading volume increased modestly to 483.6 million shares, up 4% from the previous session. The TSX recorded 90 new 52-week highs and 45 new 52-week lows. Although new highs continued to exceed new lows by a two-to-one margin, the sharp drop from Monday’s 226 new highs suggests that market momentum has cooled in the near term.
Despite the decline in the TSX Composite Index, eight of the ten major sectors finished higher, reflecting a rotation beneath the surface rather than broad-based selling.
Energy led all sectors with a gain of 1.62%, supported by strength in oil-related issues. Consumer Discretionary advanced 1.60%, indicating continued resilience in retail-oriented stocks and consumer spending themes. Telecommunications Services gained 1.29%, while Utilities rose 1.02%, reflecting renewed investor interest in defensive sectors. Technology, Healthcare, and Financials also posted gains of 0.95%, 0.39%, and 0.24%, respectively.
The major drag on the market was Basic Materials, which fell 3.92%. Precious metals and industrial metals producers experienced significant profit-taking after leading the market higher in recent months. The weakness in mining stocks was sufficient to offset gains across most other sectors and weighed heavily on the broader index.
Financials delivered a constructive performance. Canadian Imperial Bank of Commerce (CM) advanced 1.05%, Royal Bank of Canada gained 0.56%, and Bank of Montreal added 0.35%, with all three institutions reaching new 52-week highs during the session. The continued strength in Canada’s major banks remains an important source of support for the TSX given the sector’s substantial weighting within the index.
Technology stocks produced mixed results. Open Text Corp. surged 6.10%, while Shopify Inc. edged higher by 0.16%. However, Celestica Inc. declined 6.40%, giving back a portion of its recent gains.
In the mining sector, several recent leaders came under pressure. Agnico Eagle Mines fell 3.71%, Wheaton Precious Metals declined 4.09%, and Franco-Nevada retreated 2.87%. The sector’s weakness suggests traders are locking in profits following a strong multi-month advance.
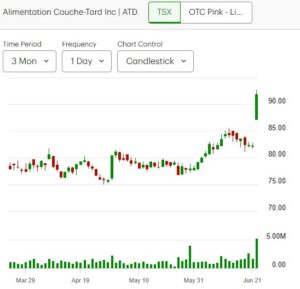
Retail stocks were among the strongest performers. Alimentation Couche-Tard Inc. (ATD) was the top-performing TSX stock of the day, surging 11.68% and closing at $91.87 on volume of 5.2 million shares. The stock’s powerful gap-up move attracted significant investor attention and provided leadership within the consumer discretionary sector.
Key Takeaways for Traders and Investors
• The TSX decline was relatively mild considering the sharp gap-down opening, indicating buyers remained active throughout the session.
• Eight of ten sectors closed higher, suggesting sector rotation rather than broad market deterioration.
• Financials continue to demonstrate leadership, with several major banks recording new 52-week highs.
• The sharp decline in Basic Materials and precious metals stocks appears to be profit-taking after a strong run rather than evidence of a major trend reversal.
• Market breadth remained negative, and the number of new 52-week highs declined significantly from Monday’s levels, indicating some loss of short-term momentum.
• The TSX remains above its key medium- and long-term moving averages, keeping the primary bullish trend intact.
• Traders should monitor whether the recent pullback develops into a deeper correction or remains a healthy consolidation within the ongoing uptrend. Continued strength in Financials, Energy, and Consumer Discretionary stocks would be a positive sign for the broader market.
.
The US Markets
Tuesday’s U.S. Market Indexes
U.S. equity markets extended their recent pullback on Tuesday, with all major indexes closing lower. The Dow Jones Industrial Average declined 45.87 points (-0.09%) to 51,666.84. The S&P 500 fell 107.33 points (-1.44%) to 7,365.46, while the Nasdaq Composite dropped 579.56 points (-2.21%) to 25,587.04. The Russell 2000 Index, which tracks small-cap stocks, lost 28.92 points (-0.96%) to finish at 2,975.48.

Large-cap stocks, represented by the Dow Jones Industrial Average, demonstrated relative strength compared with both technology and small-cap stocks. The Dow’s modest decline suggests institutional investors continued to favor established blue-chip companies amid the recent market volatility.
The Nasdaq Composite remained the weakest major index, declining more than 2% for the second consecutive session. Technology and AI-related stocks continued to face selling pressure as investors reassessed valuations and the substantial capital expenditures required to support the ongoing AI expansion. Despite the sharp decline, the Nasdaq’s intraday low remained above the recent correction low of 24,980 established on June 9, indicating that the index has not yet violated a key support level.
From a technical standpoint, the Nasdaq closed virtually on top of its 50-day moving average, a level closely watched by traders and institutional investors. A decisive break below this support level could trigger additional selling pressure and increase the likelihood of a deeper correction. Investors should monitor the index closely over the coming sessions.
The S&P 500 also experienced significant weakness, extending its retreat from recent highs. While the index remains above its 50-day moving average, it is currently trading below its 25-day moving average, reflecting a loss of short-term momentum.
Both the Nasdaq Composite and the S&P 500 have now fallen below their respective 25-day moving averages, suggesting that the market’s leadership stocks are undergoing a period of consolidation. Meanwhile, the Dow Jones appears to be entering a consolidation phase of its own, potentially forming a flat base following its strong advance earlier this year.
Key Takeaways for Traders and Investors
• Technology stocks remain under pressure as investors evaluate AI-related spending, valuations, and earnings expectations.
• The Nasdaq is testing its 50-day moving average, making this a critical technical level to watch in the near term.
• The S&P 500 remains in a longer-term uptrend but has lost short-term momentum after falling below its 25-day moving average.
• The Dow Jones continues to outperform, reflecting a rotation toward large-cap, defensive, and value-oriented stocks.
• Small-cap stocks remain challenged, as evidenced by the Russell 2000’s continued underperformance relative to the Dow.
• As long as the Nasdaq remains above its June low and the major indexes hold their 50-day moving averages, the current weakness can be viewed as a correction within an ongoing bull market rather than the beginning of a broader trend reversal.
Tuesday’s U.S. Market Statistics
New York Stock Exchange (NYSE): Market breadth on the NYSE was negative as declining issues outnumbered advancing issues. A total of 2,570 stocks declined, compared with 1,948 advancing stocks, while 440 issues closed unchanged. This resulted in a decliner-to-advancer ratio of 1.32:1, meaning that roughly four stocks declined for every three that advanced.
The NYSE recorded 120 new 52-week highs and 189 new 52-week lows. This compares with 345 new highs and 200 new lows recorded in the previous session. The sharp decline in the number of stocks reaching new highs, combined with new lows exceeding new highs, reflects a noticeable deterioration in market momentum.
Trading activity increased modestly, with total volume reaching 5.79 billion shares, up 2% from 5.67 billion shares traded on Monday. The higher volume accompanying a declining market suggests increased selling activity and profit-taking by investors.
NASDAQ: Market breadth was also negative on the Nasdaq. Declining issues totaled 2,693, while 2,208 stocks advanced and 340 issues closed unchanged. This produced a decliner-to-advancer ratio of 1.22:1, indicating that approximately five stocks declined for every four that advanced.
The Nasdaq posted 156 new 52-week highs and 282 new 52-week lows, compared with 306 new highs and 244 new lows in the previous session. The fact that new lows substantially exceeded new highs highlights the increasing weakness beneath the surface of the technology-heavy index.
Trading volume on the Nasdaq surged to 15.45 billion shares, a 22% increase from Monday’s 12.66 billion shares. The significant rise in volume alongside a sharp decline in the Nasdaq Composite suggests that institutional selling pressure was concentrated in technology and growth-oriented stocks.
Market Perspective
Tuesday’s weakness was part of a broader global equity selloff that began in Asian markets and continued through Europe before reaching North America. Investor sentiment was weighed down by renewed concerns surrounding the pace of economic growth, market valuations, and the substantial capital spending required to support the ongoing artificial intelligence (AI) expansion.
The heavy selling in technology stocks, particularly semiconductor, AI infrastructure, and chip-related companies, suggests that many investors used the recent market weakness as an opportunity to lock in profits following a strong multi-month advance. While profit-taking appears to be the primary driver of the current pullback, traders should continue monitoring market breadth, new-high/new-low statistics, and key technical support levels for signs of either stabilization or further deterioration.
Key Takeaways for Traders and Investors
• Market breadth was negative on both the NYSE and Nasdaq, confirming that Tuesday’s selloff was broad-based.
• New 52-week highs declined sharply on both exchanges, signaling a loss of upside momentum.
• New lows exceeded new highs on both exchanges, an indication that market leadership is narrowing.
• Nasdaq volume surged 22% as technology stocks came under pressure, suggesting elevated institutional activity.
• Profit-taking appears concentrated in technology, semiconductor, and AI-related stocks that have significantly outperformed over recent months.
• Investors should closely watch whether selling pressure remains confined to growth sectors or begins spreading into financials, industrials, and other cyclical groups.
• Current market internals point to a healthy correction within an ongoing bull market, but further deterioration in breadth and leadership would warrant increased caution.
Tuesday’s U.S. Market Wrap-Up Report
U.S. equities extended their recent pullback on Tuesday as investors continued to reassess technology valuations and the significant capital expenditures required to support the ongoing artificial intelligence (AI) boom. All major indexes closed lower, with the technology-heavy Nasdaq Composite leading the decline, falling 2.21%, while the S&P 500 lost 1.44%. The Dow Jones Industrial Average outperformed, slipping only 0.09%, reflecting a rotation toward more defensive and value-oriented sectors.
Sector performance was mixed. Consumer Discretionary was the strongest-performing sector, highlighting continued strength in retail-related stocks and consumer spending themes. Energy also posted a gain of 0.41%. Financials were relatively resilient, declining just 0.14%, while Basic Materials and Technology were the weakest sectors, falling 2.67% and 3.20%, respectively.
The primary source of market weakness was the semiconductor and AI infrastructure segment, where investors engaged in widespread profit-taking following several months of exceptional gains. Many of the market’s leading chipmakers and AI-related companies experienced sharp declines.
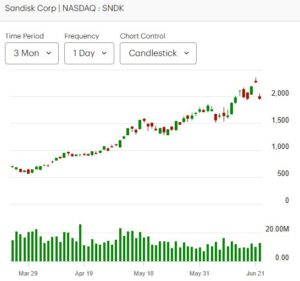
Sandisk Corporation (SNDK) fell 13.64% on volume of 12.9 million shares. Micron Technology (MU) declined 13.18% with more than 60 million shares traded. Arm Holdings PLC (ARM) dropped 10.14% on volume of 11.1 million shares, while Intel Corporation fell 6.14% with 133 million shares changing hands. Astera Labs also came under significant pressure, losing 9.70% on volume of 6.5 million shares.
The concentration of selling within the semiconductor industry suggests that investors were reducing exposure to one of the market’s strongest-performing groups rather than abandoning equities broadly. Many of these companies have generated substantial gains over the past several months, making them natural candidates for profit-taking during periods of market uncertainty.
Market internals supported the cautious tone. Both the New York Stock Exchange and Nasdaq reported negative market breadth, with declining stocks outnumbering advancing stocks. New 52-week highs fell sharply on both exchanges compared with the previous session, while new lows exceeded new highs, indicating a deterioration in short-term momentum beneath the surface of the market.
From a technical perspective, the Nasdaq closed near its 50-day moving average, an important support level closely monitored by traders and institutional investors. The S&P 500 remains above its 50-day moving average but has slipped below its 25-day moving average, while the Dow Jones appears to be entering a consolidation phase after a strong advance.
The current pullback does not yet appear to threaten the broader bull market trend. However, investors should closely monitor whether the weakness remains concentrated in technology and semiconductor stocks or begins to spread into financials, industrials, and other economically sensitive sectors.
Key Takeaways for Traders and Investors
• The selloff was concentrated in semiconductor and AI-related stocks, suggesting profit-taking rather than panic selling.
• Technology remains the market’s most important leadership group. Continued weakness in chipmakers could weigh on the Nasdaq and broader market sentiment.
• Market breadth deteriorated on both major U.S. exchanges, indicating that selling pressure was broader than the major index declines alone suggest.
• The Nasdaq’s 50-day moving average represents a critical near-term support level. A successful test could attract buyers, while a breakdown could lead to additional selling pressure.
• Investors with significant exposure to AI and semiconductor stocks may wish to review portfolio concentration risk and ensure adequate diversification across sectors and investment themes.
• Healthcare, biotechnology, financials, and other non-AI sectors may offer diversification benefits and reduce dependence on a single market theme.
• Profit-taking is an important component of risk management. Unrealized gains remain paper profits until positions are sold and converted into cash.
• The duration and depth of the current pullback will likely determine whether this proves to be a routine consolidation within an ongoing bull market or the beginning of a more significant correction.
.
NOTICE TO READERS
The Canadian Vanguard Stock Market is about empowering you to build and manage your wealth by yourself. There is certainly no magic in managing finances or wealth but one needs to know what to do and commit to doing what is needed. When you are ready to start the journey to Take Charge and Put Your Destiny In Your Own Hands, read The Canadian Vanguard every market day. If you need more related information, Contact Us
Our readers are strongly advised to conduct their own research into individual stocks before making a purchase decision. In addition, investors are advised that past stock performance is no guarantee of future price appreciation. Any recommendation is not a guarantee of any particular stock’s future prices, and The Canadian Vanguard accepts no responsibility or liability for investors’ or readers’ purchases.
Stocks In The News/ Stocks To Watch and Market Strategy will soon be available only to Paying Subscribers. The dollar sign “$” in the Toronto Market section in the articles only stands for Canadian dollar and in the US market section “$” stands for US dollar.
(c) This article is published by The Canadian Vanguard on June 23, 2026