
Dow Sets Fresh Record, but Semiconductor Selloff Halts Nasdaq’s Winning Streak
The Canadian Vanguard Stock Market Report Wednesday August 5, 2026 Edition
.
The Toronto Market
Wednesday’s Toronto Market Index
The Toronto S&P/TSX Composite Index gained 344.83 points, or 0.96%, to close at 36,146.42, extending its recent upward momentum.
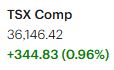

The index opened with a strong upside gap above the previous session’s close and maintained a steady advance throughout the trading day, reflecting broad-based buying interest and improving investor sentiment. The session concluded near the day’s highs, a constructive technical signal that underscores the market’s underlying strength.
From a technical perspective, the TSX remains firmly above its 25-day, 50-day, and 200-day moving averages, reinforcing the prevailing bullish trend. As long as the index continues to hold above these key support levels, the intermediate-term outlook remains favorable, with momentum continuing to support further upside potential.
.
Wednesday TSX Market Statistics Report
Market breadth was slightly negative on Wednesday, although the benchmark TSX Composite Index closed strongly higher. Declining issues marginally outnumbered advancing issues, with 1,099 decliners versus 1,063 advancers, resulting in a decliner-to-advancer ratio of 1.03:1. An additional 150 issues closed unchanged. While the breadth figures indicate a narrowly divided market, the index’s solid gain suggests that strength in larger-cap stocks more than offset weakness elsewhere.
The new highs/new lows statistics, however, painted a much more constructive picture. The TSX recorded 266 new 52-week highs and only 16 new 52-week lows, compared with 264 new highs and 33 new lows in the previous session. Although the number of new highs remained virtually unchanged, the number of new lows was cut by more than half, resulting in a significant improvement in internal market strength.
Consequently, the ratio of new 52-week highs to new 52-week lows improved from approximately 8:1 in the previous session to 16:1 on Wednesday. Such an expansion in the highs-to-lows ratio is generally viewed as a bullish technical development, indicating that buying interest is becoming increasingly broad despite the slightly negative advance-decline statistics.
Trading activity remained healthy. Total TSX volume reached 520.9 million shares. While this represented a decline from 571.1 million shares traded in the previous session, it was virtually identical to the 520.0 million shares traded on the preceding Friday, suggesting that trading activity has stabilized following the long weekend. Stable volume accompanying higher prices is generally considered a constructive sign, reflecting orderly accumulation rather than speculative excess.
Sector leadership continued to favour resource stocks. Mining companies delivered another strong performance and accounted for the overwhelming majority of the Top 25 performing stocks on the TSX, reflecting continued investor interest in the metals and mining sector amid supportive commodity prices.
Key Takeaways for Traders and Investors
- The primary trend remains bullish. The TSX continues to demonstrate strong price momentum, supported by expanding new highs and a sharp reduction in new lows.
- Market internals are improving. Although decliners slightly exceeded advancers, the dramatic improvement in the new highs-to-new lows ratio indicates that the market’s underlying technical health is strengthening.
- Volume remains supportive. Trading activity has stabilized around the 520-million-share level, suggesting investors remain actively engaged without signs of excessive speculation.
- Mining stocks continue to lead. Persistent leadership from the mining sector points to continued strength in commodity-related equities and may warrant close monitoring for additional opportunities.
- Watch for broader participation. A shift toward advancers consistently outnumbering decliners would further confirm that the current rally is broadening and becoming increasingly sustainable.
Overall, Wednesday’s market statistics reinforce the positive technical outlook for the TSX. Despite slightly negative market breadth, the combination of a higher index close, expanding 52-week highs, sharply fewer new lows, and stable trading volume suggests that the market’s underlying trend remains constructive, with institutional buying continuing to support Canadian equities.
.
The US Markets
Wednesday’s U.S. Market Index Review
U.S. equities finished mixed on Wednesday as investors took profits following a strong rally in technology stocks. The Nasdaq Composite snapped a four-session winning streak, while the S&P 500 posted a modest decline. In contrast, the Dow Jones Industrial Average outperformed, supported by continued strength in large-cap stocks.
- Dow Jones Industrial Average: +263.24 points (+0.49%) to 54,349.12
- S&P 500: -12.97 points (-0.17%) to 7,723.55
- Nasdaq Composite: -221.55 points (-0.83%) to 26,363.44
- Russell 2000: -17.79 points (-0.59%) to 3,019.19

The Nasdaq Composite paused after four consecutive sessions of strong gains. Selling pressure intensified during the final hour of trading, pushing the index well below its intraday high. Despite Wednesday’s decline, the recent rally has kept the Nasdaq comfortably above its 25-day, 50-day, and 200-day moving averages, suggesting that the weakness was more likely a healthy bout of profit-taking than a change in the prevailing uptrend.
The Russell 2000 also pulled back but continues to trade above its 25-day, 50-day, and 200-day moving averages, indicating that the broader intermediate- and long-term technical outlook remains constructive. Likewise, the S&P 500 remains above all three key moving average benchmarks, reinforcing the strength of the broader market trend despite the day’s modest decline.
From a leadership perspective, market dynamics continue to evolve. While the S&P 500 had been the strongest-performing major index in recent weeks, the Dow Jones Industrial Average has recently taken the lead as investors rotate into large-cap, blue-chip companies. Continued leadership from the Dow suggests that institutional capital remains focused on established companies, even as technology stocks pause following their recent advance.
Overall, Wednesday’s session appears to reflect normal consolidation rather than a deterioration in market conditions. As long as the major indices continue to hold above their key moving averages, the broader bullish trend remains intact, although traders should watch for whether buying interest returns after this round of profit-taking.
Here’s a revised version written for an audience of active traders and investors. I’ve removed repetitive wording, improved the flow, corrected inconsistencies, and added a Key Takeaway for Traders and Investors section that focuses on what the statistics imply rather than simply restating the data.
Wednesday’s U.S. Market Statistics
New York Stock Exchange (NYSE): Market breadth turned negative on Wednesday, with declining issues outpacing advancing issues. The NYSE recorded 2,396 decliners, 2,080 advancers, and 465 unchanged issues, resulting in a decliner-to-advancer ratio of 1.15:1.
Despite the negative breadth, underlying market strength remained encouraging. The exchange registered 513 new 52-week highs against 110 new 52-week lows, compared with 558 new highs and 91 new lows in the previous session. This produced a healthy new highs-to-new lows ratio of approximately 4.7:1, indicating that leadership continues to broaden even as the broader market experienced a modest pullback.
Total NYSE trading volume was 6.09 billion shares, broadly unchanged from the previous session. While declining stocks outnumbered advancers, the absence of a significant increase in selling volume suggests that institutional selling pressure remained relatively contained.
Overall, the NYSE statistics indicate that Wednesday’s weakness was largely driven by profit-taking rather than widespread liquidation. The continued dominance of new 52-week highs over new lows points to a market that remains technically constructive beneath the surface.
NASDAQ: The NASDAQ also experienced negative market breadth as 2,775 stocks declined compared with 2,071 advancing stocks, while 526 issues finished unchanged, producing a decliner-to-advancer ratio of 1.34:1.
Although market breadth weakened, market internals remained constructive. The exchange recorded 304 new 52-week highs and 101 new 52-week lows, compared with 337 new highs and 88 new lows in the previous session. New highs continued to comfortably outnumber new lows by approximately 3:1, indicating that leadership remains intact despite Wednesday’s pullback.
NASDAQ trading volume totaled 9.52 billion shares, approximately 7% lower than the previous session’s 10.20 billion shares. The lighter volume suggests that the decline lacked the characteristics of aggressive institutional distribution. Unless lower volume persists over several sessions, it should not be interpreted as a meaningful deterioration in market sentiment.
The relatively high number of unchanged issues (526) was somewhat unusual, but this isolated statistic does not materially alter the broader picture, as most internal indicators continue to support a healthy market environment.
Key Takeaway for Traders and Investors
Wednesday’s market internals present a more constructive picture than the headline index performance suggests. Although both the NYSE and NASDAQ recorded more declining stocks than advancing stocks, the overwhelming number of new 52-week highs relative to new lows indicates that the market’s longer-term uptrend remains intact.
The decline in trading volume, particularly on the NASDAQ, also points toward profit-taking rather than broad institutional selling. This suggests that the day’s weakness was more likely a normal pause following recent gains than the start of a sustained correction.
For traders, the key level to monitor is whether market breadth improves on the next advance. A recovery in advancing issues accompanied by expanding volume would reinforce the bullish outlook. Investors should continue to watch the new highs/new lows ratio closely; as long as new highs continue to significantly outnumber new lows, the underlying technical backdrop remains supportive of higher equity prices.
One important correction: your original draft states that the new highs-to-new lows ratio increased significantly on the NASDAQ. Based on the figures provided (304 highs vs. 101 lows, compared with 337 highs vs. 88 lows previously), the ratio actually weakened (from about 3.8:1 to 3.0:1), even though it remains healthy overall. The revised report reflects that accurately.
.
NOTICE TO READERS
The Canadian Vanguard Stock Market is about empowering you to build and manage your wealth by yourself. There is certainly no magic in managing finances or wealth but one needs to know what to do and commit to doing what is needed. When you are ready to start the journey to Take Charge and Put Your Destiny In Your Own Hands, start with reading The Canadian Vanguard every market day. If and when you need more related information or to advertise your business products or services in The Canadian Vanguard, Contact Us
Our readers are strongly advised to conduct their own research into individual stocks before making a purchase decision. In addition, investors are advised that past stock performance is no guarantee of future price appreciation. Any recommendation is not a guarantee of any particular stock’s future prices, and The Canadian Vanguard accepts no responsibility or liability for investors’ or readers’ purchases.
Stocks In The News/ Stocks To Watch and Market Strategy will soon be available only to Paying Subscribers. The dollar sign “$” in the Toronto Market section in the articles only stands for Canadian dollar and in the US market section “$” stands for US dollar.
(c) This article is published by The Canadian Vanguard on August 5, 2026