




Hot Inflation Report Sends Major U.S. Indexes Lower as Small-Caps Face Correction Risk
The Canadian Vanguard Stock Market Report – Wednesday October 14, 2026 Edition
.
The Toronto Market
Wednesday’s Toronto Market Index
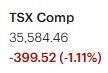
The S&P/TSX Composite Index fell 399.52 points, or 1.11%, to close at 35,584.46 on Wednesday.
The TSX ended its three-session winning streak as a sharp sell-off swept across North American equity markets, sending major indexes lower.
The release of the U.S. Consumer Price Index (CPI) report heightened concerns about inflation, triggering a broad market decline. The report indicated that inflation was higher than expected, raising concerns about the potential implications for interest rates and the economic outlook. The CPI release was clearly the key market-moving event of the day.
The decline in the TSX appeared to be driven primarily by developments in the U.S. economy rather than by Canada-specific factors. Meanwhile, geopolitical tensions in the Middle East remain elevated, continuing to disrupt oil shipments and contribute to volatility in oil prices.
From a technical perspective, Wednesday’s sell-off pushed the TSX Composite Index below both its 25-day and 50-day moving averages. However, the index remains comfortably above its 200-day moving average, suggesting that its longer-term technical position remains relatively intact despite the recent pullback.


Wednesday’s TSX Market Statistics
Declining issues significantly outnumbered advancing issues on the Toronto Stock Exchange (TSX) on Wednesday. Specifically, 1,659 issues declined, while 601 advanced, resulting in a decliner-to-advancer ratio of 2.76 to 1, or approximately three decliners for every advancer. Another 107 issues remained unchanged.
The market reversed sharply from yesterday’s very bullish breadth to a decidedly bearish outlook today. The pronounced three-to-one ratio of declining to advancing issues signals strong negative market breadth and reflects a substantial deterioration in overall market participation.
The exchange recorded 61 new 52-week highs and 102 new 52-week lows, compared with 96 new highs and 68 new lows on Tuesday. The number of new 52-week highs declined by approximately 36.5%, while new 52-week lows increased by 50%. Consequently, the ratio of new highs to new lows shifted from approximately 7:5 yesterday to 3:5 today, highlighting a clear deterioration in market internals.
A growing concern is the market’s inability to sustain improvements from one session to the next. Each time market conditions appear to improve, the following session reverses those gains and further weakens the underlying technical indicators. Yesterday’s modest improvement in market internals has now been completely erased, leaving the indicators significantly weakened.
Total trading volume on the TSX reached 482,819,628 shares, down approximately 1% from the 487,599,072 shares traded on Tuesday. Although trading volume declined slightly, the combination of sharply negative market breadth, fewer new 52-week highs, and a substantial increase in new 52-week lows points to a deterioration in the market’s underlying strength.
Overall, the TSX market outlook weakened considerably on Wednesday. The sharp reversal in market breadth and the deterioration in new-high/new-low statistics suggest that the recent market weakness remains a concern. Investors should continue to exercise caution, closely monitor market internals, and look for more sustained signs of improvement before adopting a more bullish stance.
Wednesday’s Toronto Stock Market (TSX) Wrap-Up Report
A Sharp Reversal as Market Breadth Deteriorates
The Toronto Stock Exchange (TSX) reversed Tuesday’s strong performance on Wednesday, with the S&P/TSX Composite Index falling 399.52 points, or 1.11%, to close at 35,584.46. The sell-off ended the index’s three-session winning streak and reflected a broad deterioration in investor sentiment across North American equity markets.
The release of the U.S. Consumer Price Index (CPI) report was the primary catalyst for Wednesday’s market weakness. Higher-than-expected inflation heightened concerns about the interest-rate outlook, prompting investors to reassess their positions and contributing to a widespread pullback in equities. The decline appeared to be driven primarily by developments in the U.S. economy rather than by Canada-specific factors.
Meanwhile, persistent geopolitical tensions in the Middle East continue to disrupt oil shipments and contribute to volatility in energy prices, adding another layer of uncertainty to the market outlook.
Sector Performance: Technology and Materials Lead the Decline
The sector performance was mixed, but the broader market tone was decidedly negative. Five of the ten major sectors advanced, while the other five declined. Gains in selected defensive and consumer-oriented sectors were insufficient to offset substantial losses in technology and basic materials.
Durable Consumer Goods & Services led the market, rising 2.05%. Utilities gained 0.94%, while Telecommunications advanced 0.91%. Discretionary Consumer Goods & Services rose 0.57%, and Energy edged up 0.15%.
On the downside, Financials fell 0.46%, while Healthcare declined 0.76%. Industrials and Technology dropped 1.13% and 1.35%, respectively. Basic Materials was the worst-performing sector, plunging 4.33%.
The steep decline in Basic Materials was particularly notable, while the weakness in Technology and Industrials reinforced the broader risk-off tone.
The relative resilience of Utilities, Telecommunications, and Durable Consumer Goods & Services suggests that investors were favouring selected areas of strength amid the market pullback. However, a single session of outperformance is insufficient to establish a sustained sector-rotation trend.
For traders, the immediate priority is to identify which sectors can maintain relative strength if market volatility persists. For longer-term investors, the weakness in selected sectors may warrant closer monitoring for potential entry opportunities, provided valuations, earnings prospects, and technical conditions remain favourable.
Canada’s Big Six Banks: Broad-Based Weakness
All six of Canada’s major banks finished lower on Wednesday, reflecting the negative tone across the financial sector.
| Bank | Closing price | Daily change | Volume traded |
|---|---|---|---|
| Royal Bank (RY) | $276.02 | -0.44% | 3.738M |
| CIBC (CM) | $157.31 | -0.71% | 1.490M |
| Bank of Montreal (BMO) | $233.16 | -0.86% | 2.357M |
| TD Bank (TD) | $167.57 | -0.155% | 8.016M |
| Scotiabank (BNS) | $128.14 | -0.156% | 2.508M |
| National Bank (NA) | $200.54 | -0.875% | 1.173M |
Note: Prices, percentage changes, and trading volumes are based on the supplied figures.
TD Bank was the relative outperformer among the Big Six, posting the smallest decline at approximately 0.16%, closely followed by Scotiabank at approximately 0.16%. TD also recorded the highest trading volume, with 8.016 million shares changing hands.
National Bank and Bank of Montreal were the weakest performers, falling 0.875% and 0.86%, respectively. CIBC and Royal Bank also retreated, while the declines in TD and Scotiabank were comparatively modest.
The fact that all six banks declined is significant because the major Canadian banks are important constituents of the TSX Composite Index. Their broad-based weakness reinforces the negative market tone, although the magnitude of the impact on the index depends on each stock’s weighting and individual price movement.
For active traders, relative performance within the banking group may help identify stocks showing greater resilience during market weakness. Long-term investors, meanwhile, should distinguish between a short-term market-driven pullback and a deterioration in the underlying fundamentals of individual banks.
Market Internals: A Significant Deterioration
Wednesday’s market statistics confirmed that the sell-off extended well beyond the headline index.
Declining issues outnumbered advancing issues by 1,659 to 601, producing a decliner-to-advancer ratio of approximately 2.76 to 1. Another 107 issues finished unchanged.
This represented a sharp reversal from Tuesday’s very bullish market breadth to distinctly bearish conditions. With nearly three declining stocks for every advancing stock, the breadth figures indicate that selling pressure was widespread across the exchange.
The new-high/new-low statistics also deteriorated:
- New 52-week highs: 61, down from 96 on Tuesday — a decline of approximately 36.5%.
- New 52-week lows: 102, up from 68 on Tuesday — an increase of 50%.
- New-high-to-new-low ratio: Approximately 3:5 on Wednesday, compared with 7:5 on Tuesday.
The shift from more new highs than new lows to more new lows than new highs is a notable warning sign. It suggests that the market’s underlying strength weakened considerably, even as some individual sectors managed to advance.
Total trading volume reached 482.82 million shares, down approximately 1% from Tuesday’s 487.60 million shares. Although volume declined slightly, the deterioration in breadth and the increase in new 52-week lows point to broad selling pressure rather than a healthy, narrowly concentrated rotation.
Of particular concern is the market’s repeated inability to sustain improvements in its internal indicators. Tuesday’s modest recovery in market breadth has been erased by Wednesday’s reversal, reinforcing the need for caution until the market demonstrates more consistent strength.
Technical Outlook: Short-Term Weakness, Longer-Term Support Intact
Wednesday’s sell-off pushed the S&P/TSX Composite Index below both its 25-day and 50-day moving averages. This represents a deterioration in the index’s short-term technical position and suggests that near-term momentum has weakened.
However, the index remains comfortably above its 200-day moving average. This is an important distinction: the recent decline has damaged the short-term technical picture, but the longer-term trend has not necessarily been broken.
Traders should monitor whether the index can reclaim its 25-day and 50-day moving averages and whether market breadth improves alongside any recovery. A rebound in the headline index without a corresponding improvement in advancing issues and new-high/new-low statistics would provide less convincing evidence of a sustainable recovery.
Conversely, continued weakness in market breadth, an expanding number of new 52-week lows, and further declines below key technical levels would increase the risk of additional downside pressure.
.
Key Takeaways for Traders and Investors
1. Adopt a more defensive short-term stance.
The combination of a 1.11% decline in the TSX, a nearly three-to-one decliner-to-advancer ratio, and a sharp deterioration in new-high/new-low statistics argues for caution. Traders may wish to tighten risk controls, reduce excessive position sizes, and avoid chasing short-term rebounds without confirmation.
2. Monitor sector rotation, but demand confirmation.
Utilities, Telecommunications, and Durable Consumer Goods & Services demonstrated relative strength on Wednesday. Healthcare may also merit monitoring as a potential source of future opportunities, but its 0.76% decline on the day means it did not demonstrate immediate defensive strength in this session. Investors should look for improving relative performance, stronger breadth within the sector, and supportive earnings or valuation conditions before committing capital.
3. Watch the Canadian banks for signs of stabilization.
All six major banks declined, although TD and Scotiabank showed comparatively greater resilience. Traders can monitor relative strength within the group, while longer-term investors may use market weakness as an opportunity to reassess valuations and fundamentals rather than assuming every decline represents a buying opportunity.
4. Treat the moving averages as important technical reference points.
The loss of the 25-day and 50-day moving averages weakens the short-term outlook. A recovery above these levels, accompanied by stronger market breadth, would improve the technical picture. The 200-day moving average remains an important longer-term reference point.
5. Keep U.S. inflation and geopolitical developments on the radar.
U.S. inflation data can influence expectations for interest rates, bond yields, and equity valuations, while Middle East tensions can affect oil prices and energy-sector volatility. Traders and investors should remain alert to further economic releases and geopolitical developments that could change market sentiment.
6. Avoid assuming that one session establishes a new trend.
Wednesday’s weakness is a meaningful warning, but a single trading session does not determine the market’s next direction. Confirmation from subsequent sessions, market breadth, sector leadership, and price action will be essential.
Final Market Assessment
Wednesday’s session marked a clear deterioration in the TSX’s short-term outlook. The index surrendered its recent gains, all six major Canadian banks finished lower, and market internals reversed sharply from Tuesday’s improvement. The weakness in Technology and Basic Materials added to the negative tone, while the rise in new 52-week lows suggested that selling pressure was broadening.
Although the TSX remains above its 200-day moving average, its position below the 25-day and 50-day moving averages warrants increased vigilance. Investors should resist the temptation to interpret isolated sector gains as evidence that the broader market has regained its footing.
The near-term strategy is to prioritize capital preservation, monitor sector leadership, and wait for more convincing evidence of stabilization. Selective opportunities may emerge from the sell-off, but stronger market breadth and a more sustainable recovery in the index would provide a firmer basis for increasing risk exposure.
.
The US Markets
Wednesday’s U.S. Market Indexes:
Broad Sell-Off Raises Correction Concerns
Major U.S. Indexes Close Lower
All four major U.S. equity indexes finished in negative territory on Wednesday, with technology stocks and small-cap shares bearing the brunt of the selling pressure.
- Dow Jones Industrial Average: Fell 48.62 points, or 0.09%, to close at 51,621.48.
- S&P 500: Declined 86.51 points, or 1.11%, to finish at 7,718.94.
- Nasdaq Composite: Slumped 511.51 points, or 1.88%, to close at 26,692.87.
- Russell 2000: Dropped 53.84 points, or 1.93%, to end the session at 2,729.53.

The session was characterized by pronounced weakness in growth-oriented and smaller-cap stocks, while the Dow demonstrated relative resilience. The S&P 500’s 1.11% decline marked a significant deterioration from its modest losses over the preceding two sessions, as selling pressure intensified across the broader market.
A decline of more than 1% in the S&P 500 represents a substantial setback for an index that tracks 500 leading U.S. companies. When losses approach 2%, as they did for the Nasdaq Composite and Russell 2000, the session reflects considerably stronger selling pressure, particularly in the market segments most sensitive to changes in investor sentiment and risk appetite.
Although Wednesday’s performance raises concerns about a possible deeper market pullback, one session alone is not sufficient to establish that a major market correction is underway. Further confirmation from subsequent price action, market breadth, and technical support levels will be important.
Nasdaq Under Pressure as Technology and AI Financing Concerns Persist
The Nasdaq Composite was among Wednesday’s weakest performers, falling 1.88% and moving decisively below the 27,000 level. The index has displayed growing vulnerability over the past six sessions, reflecting persistent pressure on technology-oriented stocks.
Semiconductor manufacturers and companies involved in artificial intelligence infrastructure continue to face selling pressure. At the same time, questions surrounding the financing requirements, capital expenditures, and future returns of AI-related businesses are contributing to uncertainty among investors.
The growing investment required to build AI infrastructure has prompted market participants to scrutinize whether future earnings and cash flows will justify the substantial capital commitments involved. If investors become less confident about the timing or magnitude of those returns, highly valued technology stocks may face additional valuation pressure.
This does not necessarily mean that the long-term AI investment opportunity has disappeared. Rather, the market appears increasingly sensitive to the relationship between spending, financing costs, earnings growth, and expected returns.
For traders, the immediate concern is whether technology stocks can stabilize after several sessions of weakness. For longer-term investors, the distinction between companies with sustainable earnings and cash flows and those dependent on continued financing or aggressive growth assumptions becomes particularly important during periods of heightened volatility.
Russell 2000: A Critical Technical Development
The Russell 2000 was the weakest-performing major index on Wednesday, declining 1.93%. Its performance is particularly noteworthy because the index tracks smaller U.S. companies, many of which are more sensitive to borrowing costs, domestic economic conditions, and changes in investor risk appetite.
Wednesday’s decline pushed the Russell 2000 below both its 25-day and 50-day moving averages. More importantly, the index has now reached its 200-day moving average, eliminating the technical cushion that had previously separated it from this important long-term reference level.
As noted in Tuesday’s market commentary, the gap between the Russell 2000 and its 200-day moving average had been narrowing. Wednesday’s sell-off brought that process to a critical point.
The 200-day moving average is widely monitored as an indicator of the longer-term trend. A sustained break below it could signal further technical deterioration and increase the risk of additional selling, particularly if market breadth also weakens. Conversely, a successful hold at this level, followed by a recovery above the shorter-term moving averages, would offer some evidence of stabilization.
The Russell 2000 therefore deserves close attention in the coming sessions. Its ability to hold the 200-day moving average may provide useful insight into whether investors are becoming increasingly defensive toward smaller companies and risk-sensitive segments of the U.S. equity market.
Technical Outlook: The Major Indexes Are Showing Diverging Signals
Despite Wednesday’s broad decline, the technical picture is not uniformly negative across all four major indexes.
S&P 500 and Nasdaq Composite: Both indexes remain above their 25-day, 50-day, and 200-day moving averages. Their longer-term technical structures therefore remain comparatively resilient, despite Wednesday’s sharp declines.
However, continued selling pressure could narrow the distance between current index levels and these moving averages. Traders should watch whether the indexes can stabilize and maintain their positions above these reference levels. A sustained deterioration in price action would warrant a reassessment of the current technical outlook.
Dow Jones Industrial Average: The Dow declined only 0.09%, substantially outperforming the Nasdaq and Russell 2000. Nevertheless, its technical position weakened slightly.
The index remains above its 25-day moving average but below its 50-day moving average. It continues to trade well above its 200-day moving average, suggesting that its longer-term technical position remains more resilient than its short-term configuration.
The Dow’s relative strength is encouraging, but further confirmation would be needed before concluding that investors are making a sustained shift toward more defensive or value-oriented stocks.
Russell 2000: The Russell 2000 presents the most concerning technical picture of the four indexes. It has fallen below its 25-day and 50-day moving averages and is now testing its 200-day moving average.
The outcome at this level could be particularly important. A sustained breakdown would represent a further deterioration in the index’s technical structure, while a rebound could indicate that longer-term support is attracting buyers.
Key Takeaways for Traders and Investors
1. Prioritize risk management while volatility remains elevated.
Wednesday’s declines, particularly in the Nasdaq and Russell 2000, demonstrate that selling pressure is intensifying in growth-oriented and small-cap stocks. Traders should reassess position sizes, avoid excessive leverage, and ensure that their risk exposure remains appropriate for current market conditions.
2. Watch the Russell 2000’s 200-day moving average closely.
The Russell 2000 has reached an important technical threshold. A sustained break below its 200-day moving average would be a warning sign, while a recovery above that level could provide an early indication of stabilization.
3. Monitor technology and AI-related stocks for further deterioration or stabilization.
Concerns about AI financing, capital expenditures, and future returns may continue to influence investor sentiment. Traders should pay attention to whether semiconductor and AI infrastructure stocks regain strength or continue to lead the market lower.
4. Do not assume that the market is already in a major correction.
Wednesday’s sell-off was significant, but the S&P 500 and Nasdaq remain above their respective 25-day, 50-day, and 200-day moving averages. A more convincing assessment requires follow-through from subsequent sessions and evidence of whether key support levels are holding.
5. Distinguish short-term weakness from longer-term investment opportunities.
Investors with longer time horizons may use periods of market weakness to reassess valuations and identify fundamentally strong businesses. However, buying after a sharp decline carries additional risk if the market has not yet established a bottom. Staggered entries and disciplined position sizing may help manage that uncertainty.
6. Look for confirmation before increasing market exposure.
A sustained recovery in the major indexes, improving market breadth, and stabilization in technology and small-cap stocks would provide more convincing evidence that selling pressure is easing. Until then, a selective and measured approach remains appropriate.
Final Market Assessment
Wednesday’s session marked a significant deterioration in the U.S. equity market’s short-term outlook. The S&P 500 suffered a substantial decline, while the Nasdaq Composite and Russell 2000 fell close to 2%. Technology-related concerns and weakness in small-cap stocks were prominent features of the sell-off, while the Dow demonstrated relative resilience.
The most important technical development was the Russell 2000’s move down to its 200-day moving average. Meanwhile, the S&P 500 and Nasdaq remain above their 25-day, 50-day, and 200-day moving averages, indicating that their longer-term technical structures have not yet suffered the same degree of deterioration.
The market is flashing warning signs, but confirmation is still needed before declaring a major correction. Traders should focus on protecting capital and monitoring critical support levels, while longer-term investors should remain selective and avoid confusing a lower share price with an automatically attractive buying opportunity.
The next several sessions will be important in determining whether Wednesday’s sell-off represents a temporary setback or the beginning of a more sustained market correction.
Wednesday’s U.S. Market Statistics
Market Internals Deteriorate as Selling Pressure Intensifies
Wednesday’s market statistics confirmed a significant deterioration in the underlying health of the U.S. equity market. Both the New York Stock Exchange (NYSE) and Nasdaq recorded sharply negative market breadth, a substantial increase in new 52-week lows, and higher trading volumes compared with Tuesday.
These developments reinforce the weakness observed across the major U.S. indexes, particularly the Nasdaq Composite and Russell 2000. The combination of widespread declining stocks, deteriorating new-high/new-low ratios, and increased trading activity suggests that selling pressure intensified during Wednesday’s session.
1. New York Stock Exchange (NYSE)
Market Breadth: Selling Pressure Dominates
Declining issues substantially outnumbered advancing issues on the NYSE. The exchange recorded 3,544 decliners, 1,138 advancers, and 444 unchanged issues, producing a decliner-to-advancer ratio of approximately 3.11 to 1.
In practical terms, approximately three stocks declined for every advancing stock. This represents decidedly negative market breadth and indicates that Wednesday’s weakness extended across a broad range of listed companies rather than being confined to a handful of large-cap stocks.
The breadth figures reinforce the negative performance of the major market indexes and suggest that investor sentiment deteriorated considerably during the session.
New 52-Week Highs and Lows: A Significant Deterioration
The NYSE recorded 97 new 52-week highs and 547 new 52-week lows, compared with 158 new highs and 319 new lows on Tuesday.
The changes were substantial:
- New 52-week highs declined by approximately 38.6%.
- New 52-week lows increased by approximately 71.5%.
- New-high-to-new-low ratio deteriorated from 0.50 on Tuesday to 0.18 on Wednesday.
Wednesday’s ratio of 97 new highs to 547 new lows is approximately 1:5.64. In other words, the exchange recorded fewer than one new 52-week high for every five new 52-week lows.
This is a pronounced deterioration in market internals. The sharp decline in new highs, combined with the surge in new lows, suggests that the number of stocks experiencing significant longer-term price weakness is expanding.
The pattern is particularly concerning because the market has repeatedly struggled to sustain improvements from one session to the next. Each attempted recovery appears vulnerable to renewed selling pressure, making it difficult to establish confidence in a durable market rebound.
Trading Volume: A Sharp Increase
Total NYSE trading volume reached 6.10 billion shares, approximately 22.3% higher than Tuesday’s 4.99 billion shares.
The increase in volume, combined with the sharply negative market breadth and expanding number of new 52-week lows, indicates that Wednesday’s sell-off occurred amid substantially greater trading activity.
Higher volume on a declining market can be consistent with intensified selling pressure, although volume alone cannot establish whether institutional investors are distributing shares or whether a market bottom is approaching.
NYSE assessment: The market’s internal indicators weakened considerably on Wednesday. The deterioration in breadth, the increase in new 52-week lows, and the surge in trading volume all point to a more fragile market environment.
2. Nasdaq Market Statistics
Market Breadth: An Even More Bearish Picture
The Nasdaq recorded 3,839 declining issues, 1,112 advancing issues, and 390 unchanged issues. This produced a decliner-to-advancer ratio of approximately 3.45 to 1.
That translates to roughly seven declining stocks for every two advancing stocks. The breadth figures were even more negative than those recorded on the NYSE, highlighting the significant pressure facing Nasdaq-listed equities.
This weakness is consistent with Wednesday’s 1.88% decline in the Nasdaq Composite, which fell below the 27,000 level. Technology stocks, semiconductor manufacturers, and AI infrastructure companies remain vulnerable amid concerns about AI-related spending, financing requirements, and future investment returns.
The breadth statistics confirm that the weakness extended well beyond the headline index and affected a substantial proportion of Nasdaq-listed stocks.
New 52-Week Highs and Lows: Extremely Weak Market Internals
The Nasdaq recorded just 49 new 52-week highs against 699 new 52-week lows, compared with 77 new highs and 511 new lows on Tuesday.
The deterioration was significant:
- New 52-week highs declined by approximately 36.4%.
- New 52-week lows increased by approximately 36.8%.
- New-high-to-new-low ratio fell from approximately 0.15 on Tuesday to 0.07 on Wednesday.
The resulting ratio of 49 new highs to 699 new lows is approximately 1:14.3. Put differently, the exchange recorded only about one new 52-week high for every 14 new 52-week lows.
This is an exceptionally weak reading and highlights the extent of the deterioration in Nasdaq market internals. The continued expansion in new lows suggests that weakness is spreading across a broad range of stocks, including companies outside the largest technology names.
The decline in the new-high/new-low ratio from approximately 0.15 to 0.07 in just one session is particularly concerning. It indicates that the market’s underlying strength has deteriorated further rather than stabilized.
For traders and investors, this is a warning that a rebound in a few heavily weighted technology stocks may not be enough to restore confidence in the broader Nasdaq market. A more convincing recovery would require improving participation across a wider range of stocks and a meaningful reduction in new 52-week lows.
Trading Volume: Selling Accompanied by Greater Activity
Total Nasdaq trading volume reached approximately 9.07 billion shares, up 25.2% from Tuesday’s 7.24 billion shares.
The combination of a sharp decline in the Nasdaq Composite, a substantial increase in trading volume, and deteriorating market internals makes Wednesday’s session particularly noteworthy.
Higher volume during a market decline can indicate stronger selling pressure, although it does not independently confirm that the market is entering a sustained correction. Subsequent sessions will help determine whether the selling represents continued distribution or whether buyers begin to absorb the increased supply of shares.
Nasdaq assessment: The Nasdaq’s internal indicators remain particularly weak and deteriorated further on Wednesday. The extremely low new-high/new-low ratio, combined with negative breadth and higher trading volume, suggests that the market requires a meaningful improvement in participation before a more constructive outlook can be justified.
3. NYSE vs. Nasdaq: Which Market Is Weaker?
The statistics indicate that both exchanges experienced significant deterioration, but the Nasdaq displayed the more pronounced weakness in new-high/new-low participation.
| Market indicator | NYSE | Nasdaq |
|---|---|---|
| Decliners | 3,544 | 3,839 |
| Advancers | 1,138 | 1,112 |
| Decliners per advancer | 3.11 | 3.45 |
| New 52-week highs | 97 | 49 |
| New 52-week lows | 547 | 699 |
| New highs per new low | 0.18 | 0.07 |
| Volume change vs. Tuesday | +22.3% | +25.2% |
The Nasdaq had a more negative decliner-to-advancer ratio, substantially more new 52-week lows, and a lower new-high/new-low ratio. Its trading volume also increased more sharply.
These figures reinforce the observation that growth-oriented and technology-related stocks were under particularly strong pressure. Nevertheless, the NYSE statistics show that the weakness was not confined to technology: selling pressure was widespread across the broader U.S. equity market.
Key Takeaways for Traders and Investors
1. Treat market breadth as an important warning signal.
Decliners outnumbered advancers by more than three to one on both exchanges. This is a clear indication of broad selling pressure. Traders should be cautious about interpreting gains in individual stocks or a short-lived index rebound as evidence that the wider market has recovered.
2. Monitor the new-high/new-low ratios closely.
The NYSE ratio fell to approximately 0.18, while the Nasdaq ratio dropped to approximately 0.07. These readings indicate that new 52-week lows substantially outnumber new highs. A sustained improvement in these ratios would help establish whether the market is beginning to recover internally.
3. Pay attention to the increase in trading volume.
Volume rose 22.3% on the NYSE and 25.2% on the Nasdaq. Combined with falling indexes and negative breadth, this points to intensified trading activity during the sell-off. Traders should monitor whether elevated volume persists during further declines or begins accompanying a more convincing recovery.
4. Exercise additional caution with technology and small-cap stocks.
The Nasdaq’s particularly weak internals, together with the Russell 2000’s test of its 200-day moving average, indicate vulnerability in growth-oriented and risk-sensitive segments of the market. Investors should reassess concentration in these areas and ensure that position sizes reflect their tolerance for further volatility.
5. Avoid assuming that the market has reached a bottom.
Extremely weak market internals can sometimes occur near periods of capitulation, but they can also persist during extended declines. A low new-high/new-low ratio alone is not a reliable buy signal. Confirmation should come from improving breadth, fewer new lows, stabilizing prices, and stronger follow-through in subsequent sessions.
6. Preserve flexibility and manage downside risk.
The current environment calls for disciplined risk management. Traders should establish clear exit criteria and avoid excessive leverage. Investors should distinguish between fundamentally attractive companies trading at better valuations and stocks that are falling because their earnings prospects or technical structures are deteriorating.
Final Market Assessment
Wednesday’s market statistics paint a decidedly bearish picture of the underlying U.S. equity market. Both the NYSE and Nasdaq recorded deeply negative breadth, sharply higher numbers of new 52-week lows, and increased trading volume.
The Nasdaq’s new-high/new-low ratio of approximately 0.07 is particularly concerning, while the NYSE’s ratio of approximately 0.18 confirms that the weakness extends well beyond technology stocks.
The repeated failure of market recoveries to produce sustained improvements in internal indicators is another reason for caution. Nevertheless, one session cannot establish whether Wednesday’s sell-off will develop into a prolonged correction. Further evidence from price action, trading volume, market breadth, and the behaviour of key technical support levels will be needed.
The immediate priority for traders and investors is capital preservation, not aggressive dip-buying. Selective opportunities may eventually emerge, but a more constructive stance should depend on measurable improvements in market internals and evidence that selling pressure is beginning to subside.
Wednesday’s U.S. Market Wrap-Up Report
Inflation Concerns, AI-Related Selling and Weak Market Internals Pressure Stocks
Market Overview: Broad Sell-Off Raises Caution
U.S. equity markets suffered a broad sell-off on Wednesday as hotter-than-expected inflation data, rising oil prices, and renewed concerns about the profitability and financing of artificial intelligence (AI) investments weighed on investor sentiment.
September’s Consumer Price Index (CPI) report was the day’s principal market-moving event. The report indicated that inflation was running at approximately 3.4%, heightening concerns that inflationary pressures could remain persistent and complicate the outlook for monetary policy. Investors were left reassessing the implications for interest rates, corporate borrowing costs, and equity valuations.
All four major U.S. indexes closed lower, with technology stocks and small-cap shares experiencing the heaviest losses.
- Dow Jones Industrial Average: Fell 48.62 points, or 0.09%, to close at 51,621.48.
- S&P 500: Declined 86.51 points, or 1.11%, to finish at 7,718.94.
- Nasdaq Composite: Slumped 511.51 points, or 1.88%, to close at 26,692.87.
- Russell 2000: Dropped 53.84 points, or 1.93%, to end at 2,729.53.
The Dow demonstrated relative resilience, while the Nasdaq and Russell 2000 bore the brunt of the selling pressure. The S&P 500 also suffered a substantial decline after posting comparatively modest losses during the preceding two sessions.
The Nasdaq’s retreat below 27,000 was particularly noteworthy, given its weakness over the previous six sessions. Semiconductor manufacturers, AI infrastructure companies, and other technology-related stocks continued to face selling pressure as investors questioned whether substantial AI-related capital expenditures would translate into sufficient revenue growth and investment returns.
Although Wednesday’s losses raise concerns about a deeper market pullback, one session does not establish that a major market correction is underway. The extent of further weakness will depend on subsequent price action, market breadth, and the ability of the major indexes to hold important technical support levels.
Inflation and Oil Prices Add to Market Uncertainty
In addition to the inflation report, rising oil prices contributed to the difficult trading environment.
Crude oil prices gained 0.4% to $94.14 per barrel, rebounding from an intraday low of $91.70. Oil futures have advanced 6.4% over the past four sessions, while diesel futures surged 4.5% to their highest level since September 30.
Persistent geopolitical tensions in the Middle East continue to disrupt oil shipments and contribute to volatility in energy markets. Higher oil and diesel prices can feed into transportation, manufacturing, and other operating costs, potentially complicating the inflation outlook if elevated prices persist.
This combination of inflation concerns and rising energy prices creates a challenging backdrop for equities. If inflation proves more persistent than anticipated, investors may become less confident that monetary policy can ease as quickly as hoped. Higher borrowing costs can weigh on corporate earnings expectations and place additional pressure on equity valuations, particularly among growth-oriented companies whose valuations depend heavily on future earnings.
The 10-year U.S. Treasury yield fell three basis points to 5.22% on Wednesday, but the decline did little to support stocks. Although falling Treasury yields can sometimes provide relief to equities, that relationship is not automatic. Investors may continue to sell stocks when inflation, economic uncertainty, or company-specific risks outweigh the benefit of a modest decline in yields.
A 10-year yield of 5.22% also represents a relatively high financing and discount-rate environment compared with the sub-4% levels many equity investors would prefer. Nevertheless, the appropriate yield level depends on the broader economic and inflation outlook, rather than on a single threshold.
Sector Performance: Technology Suffers the Heaviest Losses
Only four of the eleven major U.S. sectors advanced on Wednesday, highlighting the breadth of the market weakness.
Durable Consumer Goods & Services led the gainers, rising 2.06%. Healthcare followed with a 2.03% advance, while Telecommunications Services gained 1.17%. Energy edged higher by 0.22%, benefiting from the rise in oil prices.
The remaining seven sectors declined. Financials fell 1.16%, while Basic Materials dropped 1.88%. Technology was the session’s weakest sector, plunging 2.71%.
The sharp decline in Technology was especially significant given the sector’s influence on the Nasdaq and the broader market’s recent dependence on AI-related growth stocks. The weakness suggests that investors are becoming increasingly selective about companies exposed to the AI investment cycle.
Meanwhile, Healthcare and Durable Consumer Goods & Services demonstrated relative strength. These gains may point to opportunities for further investigation, but a single session of outperformance is not enough to establish a sustained sector-rotation trend.
For traders, the priority is to identify sectors and stocks that can maintain relative strength during continued market volatility. Longer-term investors should assess whether recent declines create attractive valuations in fundamentally sound businesses, rather than assuming that every heavily sold stock represents a buying opportunity.
Technology and AI Stocks: Financing and Revenue Concerns Intensify
Company-specific developments added to the pressure on technology shares, particularly businesses associated with AI infrastructure and data-center expansion.
Server Manufacturers Face Questions About AI Revenue Growth
Shares of Hewlett Packard Enterprise (HPE), Dell Technologies (DELL), and NetApp (NTAP) came under pressure after Barclays downgraded the companies, citing concerns that a meaningful AI-driven acceleration in revenue growth had yet to materialize.
Dell Technologies fell 11.27%, making it a notable casualty of Wednesday’s technology sell-off.
The downgrades highlight a growing concern among investors: substantial spending on AI infrastructure does not automatically translate into equally substantial or immediate revenue growth for every company involved in the supply chain.
Investors are increasingly scrutinizing order growth, profit margins, financing requirements, and the timing of returns on AI-related investments. Companies that fail to demonstrate tangible financial benefits from the AI investment cycle may face further valuation pressure.
For traders, the sharp decline in Dell illustrates the risks of concentrated exposure to technology stocks when market sentiment turns negative. Investors should also distinguish between short-term share-price weakness and a genuine deterioration in a company’s competitive position or earnings outlook.
CoreWeave Declines Amid Bond-Market Concerns
CoreWeave Inc. (CRWV) fell 15.46% after Elon Musk drew attention to the company’s recent bond-market sell-off.
The development added to investor concerns about financing conditions for companies making substantial investments in AI infrastructure. Businesses that require significant capital expenditure may be particularly sensitive to borrowing costs, access to credit, and the market’s willingness to finance future expansion.
The broader implication extends beyond CoreWeave itself. If investors become more cautious about the financing arrangements and expected returns of AI infrastructure projects, sentiment could weaken across other companies involved in the same investment ecosystem.
However, bond-market pressure and equity-price declines should be assessed alongside each company’s debt structure, liquidity, cash flow, and contractual revenue commitments before drawing conclusions about its financial condition.
Semiconductor and AI Infrastructure Stocks Extend Their Decline
Semiconductor stocks experienced another difficult session, extending their recent weakness to six consecutive trading sessions.
The pressure persisted despite a better-than-expected earnings report from ASML, the semiconductor equipment manufacturer. The stock’s decline following the report illustrates an important market principle: results that exceed expectations do not necessarily produce share-price gains if investors were anticipating even stronger results, more optimistic guidance, or better forward-looking conditions.
AI semiconductor companies and businesses involved in optical communications and data-center infrastructure were also hit hard.
Notable decliners included:
| Company | Ticker | Daily change |
|---|---|---|
| Coherent Corp. | COHR | -9.19% |
| Corning Inc. | GLW | -5.15% |
| Lumentum Holdings | LITE | -9.28% |
| Marvell Technology | MRVL | -8.72% |
| Sandisk Corp. | SNDK | -5.33% |
| Seagate Technology | STX | -4.50% |
| Western Digital | WDC | -4.36% |
The declines across optical components, semiconductor-related businesses, data-storage companies, and AI infrastructure suppliers indicate that selling pressure is affecting a broad range of companies connected to the technology investment cycle.
The six-session decline in semiconductor stocks is particularly important for traders to monitor. A sustained retreat in this group could continue to weigh on the Nasdaq and other indexes with substantial technology exposure.
For longer-term investors, the key question is whether the recent weakness reflects temporary valuation adjustments and profit-taking or a more fundamental reassessment of future demand, earnings growth, and AI-related capital spending. Company-specific analysis remains essential because businesses operating in the same broad industry can have very different financial profiles and growth prospects.
Market Internals: Selling Pressure Broadens Across Both Exchanges
Wednesday’s market statistics confirmed that the weakness extended well beyond the headline indexes.
New York Stock Exchange (NYSE): Declining issues outnumbered advancing issues by 3,544 to 1,138, producing a decliner-to-advancer ratio of approximately 3.11 to 1. Another 444 issues remained unchanged.
The exchange recorded 97 new 52-week highs and 547 new 52-week lows, compared with 158 new highs and 319 new lows on Tuesday. New highs declined by approximately 38.6%, while new lows increased by approximately 71.5%.
NYSE trading volume reached approximately 6.10 billion shares, up 22.3% from Tuesday.
NASDAQ: Declining issues totalled 3,839, compared with 1,112 advancing issues and 390 unchanged issues. The decliner-to-advancer ratio was approximately 3.45 to 1, indicating even weaker breadth than on the NYSE.
The Nasdaq recorded 49 new 52-week highs and 699 new 52-week lows. Compared with Tuesday, new highs fell by approximately 36.4%, while new lows increased by approximately 36.8%.
The Nasdaq’s new-high-to-new-low ratio deteriorated from approximately 0.15 on Tuesday to 0.07 on Wednesday. In practical terms, there were approximately 14 new 52-week lows for every new 52-week high.
Nasdaq trading volume surged to approximately 9.07 billion shares, up 25.2% from Tuesday.
These statistics are concerning because both exchanges experienced negative breadth, rising volume, and a substantial imbalance between new highs and new lows. The Nasdaq’s particularly weak readings reinforce the vulnerability of technology-oriented and growth-sensitive stocks.
The combination of falling indexes and rising trading volume is consistent with intensified selling activity, although it does not by itself confirm that institutional distribution is occurring or that a prolonged correction is inevitable.
The repeated failure of market internals to sustain improvements is another warning sign. Traders and investors should look for a more durable recovery in advancing issues, fewer new lows, and improved participation across sectors before concluding that market conditions have stabilized.
Technical Outlook: The Russell 2000 Faces a Critical Test
Wednesday’s market decline also produced important technical developments.
S&P 500 and Nasdaq Composite: Both indexes remain above their 25-day, 50-day, and 200-day moving averages. Their longer-term technical structures therefore remain comparatively resilient, although continued selling could threaten these positions.
Dow Jones Industrial Average: The Dow remains above its 25-day moving average and well above its 200-day moving average, but below its 50-day moving average. Its relatively small daily decline demonstrates greater resilience than that of the Nasdaq and Russell 2000.
Russell 2000: The Russell 2000 fell below both its 25-day and 50-day moving averages and reached its 200-day moving average. This is the most concerning technical development among the four major indexes. A sustained break below this level would signal further deterioration, while a successful hold and recovery could provide an early indication of stabilization.
These differences matter. The market is showing significant short-term weakness, but the technical damage is not yet uniform across all major indexes. Traders should monitor how the indexes behave around their moving averages and whether any recovery is accompanied by improving market breadth.
Key Takeaways for Traders and Investors
1. Prioritize capital preservation while selling pressure remains elevated.
Wednesday’s sharp declines, deteriorating market internals, and higher trading volumes warrant a cautious approach. Traders should reassess position sizes, manage leverage carefully, and maintain clear exit criteria. Avoiding unnecessary losses can be more important than attempting to capture every short-term rebound.
2. Be selective with AI and semiconductor exposure.
The weakness across server manufacturers, semiconductor-related companies, optical communications businesses, and data-storage stocks suggests that AI-related investments are facing increased scrutiny. Investors should focus on sustainable revenue growth, profitability, balance-sheet strength, and the ability to generate returns on substantial capital expenditure.
3. Monitor the Russell 2000’s 200-day moving average.
The Russell 2000’s test of its 200-day moving average is an important technical warning. A sustained breakdown, particularly alongside further deterioration in market breadth, would strengthen the bearish case. A recovery above this level would be more constructive, especially if accompanied by improving participation.
4. Watch inflation and oil prices for further market implications.
Persistent inflation and elevated energy prices could complicate the interest-rate outlook and weigh on corporate margins. Further economic data, Treasury-yield movements, and geopolitical developments will remain important drivers of market sentiment.
5. Do not mistake sector strength for a confirmed rotation.
Healthcare and Durable Consumer Goods & Services outperformed on Wednesday, but one session is insufficient to establish a durable trend. Traders should look for sustained relative strength and improving price action before treating these sectors as confirmed destinations for defensive capital rotation.
6. Avoid aggressive dip-buying before the market stabilizes.
The substantial increase in new 52-week lows and the deterioration in market breadth suggest that weakness remains widespread. Investors may eventually find attractive entry points, but further declines are possible. Staggered purchases, disciplined position sizing, and fundamental screening can help manage the risks associated with entering a falling market.
7. Look for confirmation rather than attempting to predict the bottom.
A more convincing recovery would involve improving breadth on both exchanges, fewer new 52-week lows, stabilization in technology and semiconductor stocks, and the ability of the major indexes to hold key support levels. A rally led by only a few large-cap stocks would be less persuasive.
Final Market Assessment
Wednesday’s session exposed several vulnerabilities in the U.S. equity market. Hotter-than-expected inflation, rising oil prices, concerns about AI financing and revenue growth, and another difficult session for semiconductor stocks combined to push all four major indexes lower.
The Nasdaq and Russell 2000 were the weakest performers, while the NYSE and Nasdaq market statistics confirmed that selling pressure extended across a broad range of stocks. The sharp increase in trading volume and the widening imbalance between new 52-week highs and lows further weakened the near-term outlook.
Nevertheless, the S&P 500 and Nasdaq remain above their 25-day, 50-day, and 200-day moving averages, while the Russell 2000 is testing its 200-day moving average. The technical picture therefore calls for vigilance rather than an assumption that a major correction has already begun.
The immediate priority is to manage risk, remain selective, and wait for evidence that the market is stabilizing. Traders should avoid excessive exposure to vulnerable stocks, while longer-term investors should concentrate on business fundamentals and valuations rather than buying solely because prices have fallen.
The next several trading sessions will be important in determining whether Wednesday’s sell-off is a temporary setback or the beginning of a more sustained market correction. Improving market breadth, fewer new lows, and renewed strength in technology stocks would help support a more constructive outlook.
.
NOTICE TO READERS
The Canadian Vanguard Stock Market is about empowering you to build and manage your wealth by yourself. There is certainly no magic in managing finances or wealth but one needs to know what to do and commit to doing what is needed. When you are ready to start the journey to Take Charge and Put Your Destiny In Your Own Hands, start with reading The Canadian Vanguard every market day. If and when you need more related information or to advertise your business products or services in The Canadian Vanguard, Contact Us
Our readers are strongly advised to conduct their own research into individual stocks before making a purchase decision. In addition, investors are advised that past stock performance is no guarantee of future price appreciation. Any recommendation is not a guarantee of any particular stock’s future prices, and The Canadian Vanguard accepts no responsibility or liability for investors’ or readers’ purchases.
Stocks In The News/ Stocks To Watch and Market Strategy will soon be available only to Paying Subscribers. The dollar sign “$” in the Toronto Market section in the articles only stands for Canadian dollar and in the US market section “$” stands for US dollar.
(c) This article is published by The Canadian Vanguard on October43, 2026