







Markets Rebound as Long-Term Bond Yields Rise and Oil Prices Slip
The Canadian Vanguard Stock Market Report Weekend August 21 – 23, 2026 Edition
.
The Toronto Market
Friday Toronto Market Index
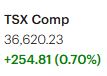
The Toronto S&P/TSX Composite index advanced 254.81 points or 0.70%, and closed at 36,620.23.
The TSX index bounced back on Friday. However, the rebound was not broad-based and was dominated by precious and industrial metal or fuel material mining companies. Only three of the top twenty five stocks in the TSX on Friday were non mining companies.
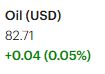
The TSX internals remain strong. However, government bond’s yield edged up on Friday. The 10-year Treasury yield was up four basis points while oil price was down slightly. The TSX index, remains high above the 25-day, 50-day and the 200-day moving averages even after closing in the red today.

Friday’s TSX Market Statistics
At the TSX, advancing issues (advancers) significantly outnumbered declining issues (decliners). There were 1,426 advancers and 713 decliners, producing an advancer-to-decliner ratio of 2 to 1—two advancers for every decliner. A total of 137 issues were unchanged.
The exchange recorded 60 new 52-week highs and 60 new 52-week lows, compared with 61 new 52-week highs and 48 new 52-week lows on Thursday.
Overall, market breadth remained positive and bullish. Market internals also remained strong, although they appear somewhat stretched. The number of new 52-week highs was essentially unchanged from the previous day, while new 52-week lows increased by 25%, matching the number of new 52-week highs.
As a result, the ratio of new 52-week highs to new 52-week lows on Friday was 1 to 1, compared with approximately 6 to 5 on Thursday. Despite this deterioration in the new-high/new-low ratio, the broader market internals remain strong and continue to support a bullish market outlook.
.
Friday’s Toronto TSX Market Wrap-Up Report
The Toronto market bounced back on Friday, with the S&P/TSX Composite Index advancing 254.81 points, or 0.70%, to close at 36,620.23. The rebound came after Thursday’s sell-off, but it was not broad-based. Only five of the ten major sectors finished higher, and the market remained under pressure on a weekly basis. Overall, it was a difficult week for the TSX, despite Friday’s recovery.
Market Breadth and Internals
Friday’s market internals were encouraging. Advancing issues significantly outnumbered declining issues, with 1,426 advancers versus 713 decliners, producing a strong 2-to-1 advance/decline ratio. Another 137 issues were unchanged.
However, the new-high/new-low data was less convincing. The TSX recorded 60 new 52-week highs and 60 new 52-week lows, compared with 61 new highs and 48 new lows on Thursday. The number of new highs was essentially unchanged, while new lows increased by approximately 25%. Consequently, the new-high-to-new-low ratio deteriorated from approximately 6-to-5 on Thursday to 1-to-1 on Friday.
This suggests that while the overall market breadth remains positive and bullish, some deterioration is occurring underneath the surface. The market internals remain strong, but they are becoming somewhat stretched and warrant closer monitoring.
Sector Performance and Market Rotation
Basic Materials was once again the dominant sector, gaining 3.16% on Friday and extending its leadership for the second consecutive trading day. The sector was driven largely by precious and industrial metals miners, with gold, silver and copper mining companies dominating the list of the top-performing TSX stocks.
Of particular note, the rebound was heavily concentrated in mining stocks. Only a small number of the top 25 TSX performers were non-mining companies. This concentration makes Friday’s market advance less convincing than a broad-based rally led by multiple sectors.
Consumer Discretionary Goods & Services gained 0.86%, while Technology, Industrials and Financials advanced 0.56%, 0.34% and 0.29%, respectively.
On the weaker side, Telecommunications Services, Durable Consumer Goods & Services, and Utilities declined 0.29%, 0.45% and 2.81%, respectively. Utilities and telecommunications are traditionally viewed as more defensive areas of the market, so their weakness is another indication that Friday had more of a risk-on character, with investors favouring cyclical and commodity-related stocks.
Weekly Sector Performance
Despite Friday’s recovery, the weekly performance tells a more challenging story.
Basic Materials was the clear weekly leader, gaining 10.37%, followed by Energy at 1.57% and Healthcare at 0.94%.
The weakest sectors were Financials, down 4.99%, Utilities, down 3.83%, and Technology, down 2.74%.
The divergence between Basic Materials and Financials is particularly noteworthy. It indicates that Friday’s strength was not simply a broad recovery in the Canadian equity market but rather a significant rotation toward commodity-related stocks.
Bonds, Gold and Oil
The bond market remains an important factor for TSX investors. The 10-year government bond yield rose to approximately 3.76%, its highest level in about two years. Rising bond yields mean falling bond prices and can translate into higher long-term borrowing costs for consumers and businesses.
The global sell-off in government bonds is also contributing to a rotation toward gold. Gold prices have been climbing, while gold-mining equities have attracted increased investor interest. At the same time, oil prices remain elevated, creating an ongoing risk of higher inflation and potentially keeping pressure on interest rates.
For equity investors, the combination of higher bond yields, elevated oil prices and strong gold prices is an important macroeconomic backdrop to monitor.
Gold Miners and Energy Stocks
The rotation toward precious-metal miners was particularly evident on Friday.
Agnico Eagle Mines (AEM) gained 1.95% to close at $297.82, with approximately 1.9 million shares traded. It is important to remember that nothing goes up forever so the stock must pause or pullback after sessions of gain.
SSR Mining (SSRM) rose 2.32% to close at $52.02, with approximately 593,200 shares traded.
The strength in gold-mining stocks is consistent with the broader move toward precious metals as investors respond to rising bond yields and uncertainty in global bond markets.
Technical Picture
Despite the difficult week, the TSX’s broader technical picture remains constructive. The index continues to trade well above its 25-day, 50-day and 200-day moving averages.
This is important for traders. The recent weakness has not yet broken the broader upward trend. Friday’s strong advance/decline ratio also suggests that buyers remain active.
However, the deterioration in the new-high/new-low ratio deserves attention. A market can continue rising while its internal momentum gradually weakens. Traders should therefore watch whether the number of new highs begins to expand again or whether new lows continue to increase.
Key Takeaways for Traders and Investors
- Friday’s 0.70% rebound was positive, but not broad-based. Mining and Basic Materials stocks were responsible for a significant portion of the advance.
- Market breadth was strong. The 2-to-1 advancer-to-decliner ratio indicates substantial buying participation.
- New-high/new-low breadth was less encouraging. New highs and new lows were equal on Friday, a deterioration from Thursday’s approximately 6-to-5 ratio.
- Basic Materials remains the market’s strongest sector. Its 10.37% weekly gain and continued leadership point to a significant rotation toward commodity-related stocks.
- Financials remain under pressure. The sector’s 4.99% weekly decline is particularly important because Financials carry significant weight in the TSX.
- Friday appeared to be a risk-on session. Defensive sectors such as Utilities and Telecommunications underperformed while commodity and cyclical stocks gained.
- The TSX’s longer-term technical trend remains bullish. The index continues to trade above its 25-day, 50-day and 200-day moving averages.
- Bond yields remain a major risk factor. The 10-year government yield at approximately 3.76% could continue to influence equity valuations and borrowing costs.
- Gold miners deserve continued attention. The strength in gold and mining stocks suggests that the commodity rotation may have further momentum, although traders should watch for signs of exhaustion after the sharp weekly gains in Basic Materials.
- Bottom line: Friday’s rebound was encouraging, but traders should not interpret it as confirmation that the entire market has regained momentum. The stronger advance/decline breadth is bullish, while the deterioration in new highs versus new lows is a cautionary signal. For now, the TSX’s primary trend remains positive, but market leadership is becoming increasingly concentrated in commodity-related stocks.
.
The US Markets
Friday’s U.S. Market Indexes
The U.S. stock market reversed Thursday’s sell-off on Friday, with all four major indexes closing higher. The broad-based rebound is encouraging and suggests that Thursday’s decline was, at least for now, a one-session sell-off rather than the beginning of a broader market correction.
The Dow Jones Industrial Average rallied 517.80 points, or 0.98%, to close at 53,277.01. The S&P 500 gained 33.21 points, or 0.43%, finishing at 7,674.37. The Nasdaq Composite advanced 113.29 points, or 0.43%, to close at 26,180.45. The Russell 2000 rebounded 25.44 points, or 0.85%, to finish at 3,017.87.

The Russell 2000 was the strongest performer among the four major indexes, gaining nearly 1% and recovering from Thursday’s weakness. The index had fallen slightly below the important 3,000 level on Thursday but reclaimed that level on Friday. The ability of small-cap stocks to recover quickly is a positive sign for overall market sentiment and suggests that investors were willing to move back into riskier assets following Thursday’s sell-off.
Despite Friday’s gains, the weekly picture remains mixed. The Dow Jones has now recorded losses for two consecutive weeks, while the Russell 2000 finished the week with a slight decline. This suggests that Friday’s rebound should be viewed as encouraging, but not yet as confirmation that all of the recent weakness has been fully reversed.
Technical Picture
The technical picture remains broadly constructive.
The Nasdaq Composite has fallen below its 25-day moving average, which is a short-term warning signal. However, it remains well above its 50-day and 200-day moving averages, indicating that its intermediate- and long-term trends remain intact.
The S&P 500 and Russell 2000 remain well above their 25-day, 50-day and 200-day moving averages. This is an important positive signal because the recent sell-off has not yet caused a meaningful breakdown in the broader market’s technical structure.
Key Takeaway for Traders and Investors
Friday’s rebound was a positive development and significantly reduced concerns that Thursday’s sell-off was the beginning of a broader market decline. The strongest performance came from the Russell 2000, which reclaimed the psychologically important 3,000 level.
However, traders should not ignore the warning signs. The Nasdaq’s loss of its 25-day moving average and the Dow’s two consecutive weekly declines indicate that some areas of the market are losing momentum.
For now, the broader U.S. market trend remains bullish, but the next few sessions will be important. Traders should look for follow-through buying, particularly in the Nasdaq and Russell 2000, to confirm that Friday’s rebound represents renewed buying interest rather than simply a temporary bounce after Thursday’s sell-off.
.
Friday’s U.S. Market Statistics
New York Stock Exchange (NYSE): Market breadth on the New York Stock Exchange improved significantly on Friday. Advancing issues outnumbered declining issues by a substantial margin, with 2,810 advancers, 1,674 decliners, and 570 unchanged issues. This produced an advancer-to-decliner ratio of approximately 1.67-to-1, or roughly eight advancers for every five decliners.
The NYSE recorded 214 new 52-week highs and 118 new 52-week lows, compared with 156 new highs and 132 new lows on Thursday. This was a meaningful improvement in market internals. New highs increased by approximately 37%, while new lows declined by approximately 11%.
The new-high-to-new-low ratio improved to approximately 9-to-5, compared with roughly 6-to-5 on Thursday. The combination of stronger breadth, more new highs, and fewer new lows indicates that the market internals reversed Thursday’s deterioration and turned bullish on Friday.
Total NYSE trading volume was approximately 4.59 billion shares, down 7% from Thursday’s 4.91 billion shares. Although volume declined while the market advanced, the change was within the normal day-to-day fluctuations in trading activity and does not appear significant enough to alter the overall interpretation of Friday’s market action.
Bottom line: NYSE market breadth and internals strengthened considerably on Friday. The sharp improvement in new highs versus new lows is particularly encouraging and supports the view that Thursday’s sell-off was not the beginning of a broad market deterioration.
NASDAQ: The NASDAQ also experienced a significant improvement in market breadth on Friday. There were 3,204 advancing issues and 1,746 declining issues, with 200 issues unchanged. This produced an advancer-to-decliner ratio of approximately 1.83-to-1, or nearly two advancers for every decliner.
Friday’s positive breadth essentially reversed Thursday’s deterioration. The NASDAQ recorded 152 new 52-week highs and 110 new 52-week lows, compared with 109 new highs and 138 new lows on Thursday.
The improvement in new highs and new lows was substantial. New 52-week highs increased by approximately 40%, while new 52-week lows declined by approximately 20%. The resulting new-high-to-new-low ratio was approximately 7-to-5, indicating that market internals had returned to bullish territory following Thursday’s sell-off.
One encouraging characteristic of the NASDAQ internals is their ability to recover quickly after temporary deterioration. The new-high/new-low ratio has repeatedly returned to levels indicating market strength following short-term weakness. This resilience suggests that the underlying market remains healthy, although a few additional trading sessions will be needed to determine whether the market is entering a pattern of alternating gains and losses or establishing a more sustainable direction.
NASDAQ trading volume totaled approximately 7.61 billion shares, down 10% from Thursday’s 8.54 billion shares. The lower volume could suggest somewhat reduced conviction behind Friday’s advance. However, the NASDAQ also finished well above its session low and successfully reversed Thursday’s bearish sell-off. That price action is a more important positive signal than the modest decline in volume.
Key Takeaways for Traders and Investors
- Market breadth turned decisively positive on both exchanges. Advancers substantially outnumbered decliners on the NYSE and NASDAQ.
- NYSE internals strengthened significantly. The new-high/new-low ratio improved to approximately 9-to-5.
- NASDAQ internals also returned to bullish territory, with a new-high/new-low ratio of approximately 7-to-5.
- New highs increased sharply on both exchanges, while new lows declined. This is one of the strongest indications that Friday’s rebound had meaningful internal support.
- Friday’s action reversed much of Thursday’s deterioration, supporting the view that Thursday’s sell-off may have been a temporary event rather than the start of a broad market breakdown.
- Lower trading volume is a minor cautionary signal, particularly on the NASDAQ, but the decline was not large enough by itself to undermine Friday’s positive market action.
- The next few sessions are important. If positive breadth and strong new-high/new-low ratios persist, Friday’s rebound will have greater technical credibility. If breadth deteriorates again, the market may instead be entering a period of alternating advances and declines.
- Bottom line: Friday’s market internals were clearly bullish and stronger than Thursday’s. Both breadth and the new-high/new-low data improved materially, providing solid confirmation that buyers returned to the market following Thursday’s sell-off. For now, the internal structure of the U.S. equity market remains strong.
.
Friday U.S. Market Wrap-Up Report
The U.S. stock market bounced back strongly on Friday, reversing much of Thursday’s sharp sell-off. All four major indexes finished higher, and the rebound was supported by positive market breadth and improving internal indicators. The Dow Jones Industrial Average gained 0.98%, the S&P 500 advanced 0.43%, the Nasdaq Composite rose 0.43%, and the Russell 2000 gained 0.85%.
The breadth of the rebound was encouraging. Eight of the eleven major sectors finished higher, indicating that Friday’s recovery was not limited to a handful of large-cap stocks.
Market Breadth and Internals
Friday’s market internals were particularly encouraging and effectively reversed much of Thursday’s deterioration.
On the NYSE, there were 2,810 advancing issues versus 1,674 declining issues, producing an advance/decline ratio of approximately 1.67-to-1. The exchange also recorded 214 new 52-week highs versus 118 new lows, improving the new-high/new-low ratio to approximately 9-to-5.
NASDAQ breadth was even stronger, with 3,204 advancers versus 1,746 decliners, producing an advance/decline ratio of approximately 1.83-to-1. There were 152 new 52-week highs and 110 new lows, giving the NASDAQ a new-high/new-low ratio of approximately 7-to-5.
The improvement in new highs and reduction in new lows on both exchanges is important. New highs increased sharply while new lows declined, indicating that Friday’s rebound had meaningful internal support rather than being driven solely by a few major indexes.
Trading volume was lower on both exchanges, but the decline was not large enough to materially change the interpretation of the session. More importantly, the NASDAQ finished well above its session low after reversing Thursday’s sell-off.
Overall, U.S. market internals turned bullish again on Friday.
Sector Performance
Friday’s advance was broad-based, with eight of the eleven major sectors gaining.
Basic Materials was the strongest sector, advancing 2.97%. Healthcare gained 1.25%, Consumer Discretionary Goods & Services rose 1.18%, and Financials advanced 1.05%. Telecommunications Services gained 0.87%, Industrials rose 0.81%, Durable Consumer Goods & Services added 0.44%, and Technology gained 0.22%.
On the downside, Energy slipped 0.14%, while Utilities fell 1.87% and was the session’s weakest sector.
The sector rotation was notable. Basic Materials’ leadership, combined with weakness in traditionally defensive Utilities, suggests that Friday had a relatively risk-on character.
Weekly Sector Performance
The weekly picture was more mixed.
Healthcare was the strongest sector for the week, gaining 8.37%, followed by Basic Materials at 6.27%. Energy gained 2.59%, while Consumer Discretionary Goods & Services was essentially flat, advancing 0.13%.
The weaker sectors were Financials, down 1.65%, Technology, down 2.60%, and Utilities, down 3.56%.
The divergence between strong Healthcare and Basic Materials and weaker Technology, Financials and Utilities is worth monitoring. It suggests that investors are rotating among sectors rather than simply buying the entire market indiscriminately.
Bonds, Oil, Gold and Geopolitical Risk
The bond market and geopolitical developments remain important market-moving factors.
Long-term Treasury yields, particularly the 10-year and 30-year yields, moved higher on Friday after declining on Thursday. Comments from the U.S. administration regarding an economic war with Iran added uncertainty surrounding the conflict and the future of shipping through the Strait of Hormuz.
Any prolonged disruption to shipping through the Strait of Hormuz could put upward pressure on oil prices and inflation expectations. Higher oil prices could, in turn, keep pressure on long-term bond yields and borrowing costs.
At the same time, gold remains strong as investors seek protection against geopolitical uncertainty, inflation risks and instability in government bond markets.
For traders, developments involving the U.S. and Iran should remain high on the watchlist. Geopolitical headlines can move oil, gold, bond yields and equity markets very quickly.
Small Caps Show Strength
The Russell 2000’s Friday performance deserves particular attention. The index gained 0.85%, outperforming both the S&P 500 and Nasdaq, and recovered back above the psychologically important 3,000 level after falling slightly below it on Thursday.
This is a constructive development for risk appetite. Small-cap stocks are generally more sensitive to domestic economic conditions and financial conditions, so their ability to rebound quickly after Thursday’s sell-off is encouraging.
However, the Russell 2000 still finished the week slightly lower, so traders should look for follow-through before concluding that the recent weakness has been fully reversed.
Technical Picture
The broader technical structure remains bullish, although there are some areas of caution.
The S&P 500 and Russell 2000 remain well above their 25-day, 50-day and 200-day moving averages, maintaining strong intermediate- and long-term trends.
The Nasdaq Composite is no longer above its 25-day moving average, which is a short-term warning signal. However, it remains well above its 50-day and 200-day moving averages. Therefore, the Nasdaq’s longer-term trend remains intact despite the recent weakness.
The next few sessions will be important. Follow-through buying would strengthen the case that Thursday’s sell-off was simply a temporary correction. A renewed decline accompanied by deteriorating breadth and increasing new lows would provide a different signal.
Stocks to Watch
Micron Technology (MU): Micron Technology remains an interesting stock for traders because of its extraordinary performance this year. MU closed at $312.15 on January 4 and finished Friday at $966.78, with approximately 21.8 million shares traded. The stock has therefore more than tripled since the beginning of the year.
Micron reached a yearly closing high of $1,214 on June 25, when approximately 83 million shares changed hands.
The question for traders is whether MU can eventually revisit that high. Rather than attempting to predict whether it will, traders may find it more useful to monitor price action, volume, relative strength and market conditions to determine whether the stock is developing another sustained move.
Optoelectronics Stocks: Optoelectronic stocks, which outperformed on Thursday, gave back some ground on Friday, although the declines were relatively modest.
- Lumentum Holdings (LITE) declined 1.43% to $866.71 on 3.7 million shares.
- Corning (GLW) fell 1.10% to $149.78 on 6.2 million shares.
- Applied Optoelectronics (AAOI) declined 3.32% to $124.82 on 9.7 million shares.
The reversal in leadership is worth watching, particularly if weakness in these stocks persists while the broader technology sector remains stable.
Gold Miners: Gold-mining stocks continued to outperform, supported by strength in gold and the broader rotation toward precious metals.
- AngloGold Ashanti (AU) gained 5.95% to $121.23 on 6.2 million shares.
- Agnico Eagle Mines (AEM) rose 1.98% to $216.23 on 5.4 million shares.
- Franco-Nevada (FNV) advanced 2.98% to $265.83 on 1.1 million shares.
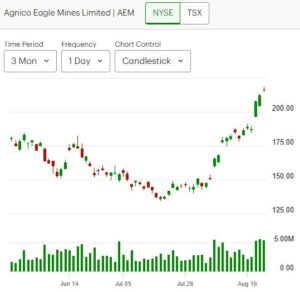
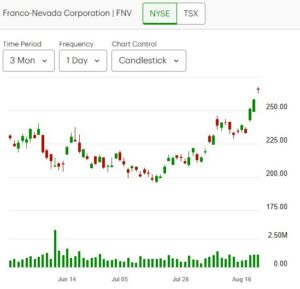
The continued strength in gold miners is consistent with the broader market’s preference for precious metals amid geopolitical and macroeconomic uncertainty.
Moderna (MRNA): Moderna was another stock worth adding to the watchlist. The stock has displayed significant day-to-day volatility recently, outperforming on Wednesday, underperforming on Thursday and then strongly outperforming again on Friday.
MRNA gained 8.86% on Friday to close at $145.13, with approximately 87.3 million shares traded.
The combination of a large price move and exceptionally heavy volume makes MRNA an interesting momentum stock to monitor. Traders should watch whether Friday’s move receives follow-through or fades in subsequent sessions.
Key Takeaways for Traders and Investors
- Friday’s rebound was broad-based and internally strong. All four major indexes gained, while eight of eleven major sectors advanced.
- Market breadth turned bullish again. Both the NYSE and NASDAQ recorded substantially more advancers than decliners.
- New-high/new-low data improved significantly. The NYSE reached approximately a 9-to-5 ratio and the NASDAQ approximately 7-to-5.
- The Russell 2000 reclaimed 3,000, an encouraging sign for risk appetite and small-cap stocks.
- The S&P 500 and Russell 2000 remain technically strong, trading above their 25-day, 50-day and 200-day moving averages.
- The Nasdaq’s loss of its 25-day moving average remains a short-term warning, even though its longer-term trend is still bullish.
- Basic Materials and gold miners remain important areas of strength, while Utilities continue to lag.
- Geopolitical developments involving the U.S. and Iran remain a major market risk. Traders should pay particular attention to oil prices, the Strait of Hormuz, Treasury yields and gold.
- Friday’s lower trading volume is not a major concern by itself. The much more important development was the strong reversal of Thursday’s sell-off and improvement in market internals.
- Bottom line: Friday’s session was constructive. The combination of strong breadth, improving new-high/new-low ratios, a broad sector rebound and a recovery in small caps suggests that Thursday’s sell-off was not, at least yet, the beginning of a broad market breakdown. Nevertheless, traders should look for follow-through in the coming sessions before declaring the correction fully over. The market remains bullish, but geopolitical risk, rising long-term yields and the Nasdaq’s loss of its 25-day moving average warrant continued caution.
.
NOTICE TO READERS
The Canadian Vanguard Stock Market is about empowering you to build and manage your wealth by yourself. There is certainly no magic in managing finances or wealth but one needs to know what to do and commit to doing what is needed. When you are ready to start the journey to Take Charge and Put Your Destiny In Your Own Hands, start with reading The Canadian Vanguard every market day. If and when you need more related information or to advertise your business products or services in The Canadian Vanguard, Contact Us
Our readers are strongly advised to conduct their own research into individual stocks before making a purchase decision. In addition, investors are advised that past stock performance is no guarantee of future price appreciation. Any recommendation is not a guarantee of any particular stock’s future prices, and The Canadian Vanguard accepts no responsibility or liability for investors’ or readers’ purchases.
Stocks In The News/ Stocks To Watch and Market Strategy will soon be available only to Paying Subscribers. The dollar sign “$” in the Toronto Market section in the articles only stands for Canadian dollar and in the US market section “$” stands for US dollar.
(c) This article is published by The Canadian Vanguard on August 22, 2026



