
Markets Close Mixed: TSX Pulls Back While U.S. Indexes Extend Their Recovery; Semiconductor Rotation Remains in Focus
The Canadian Vanguard Stock Market Report Weekend July 31-August 2, 2026 Edition
.
The Toronto Market
Friday’s Toronto Market Index
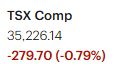
The S&P/TSX Composite Index fell 279.70 points, or 0.79%, to close at 35,226.14.
The TSX opened below the previous session’s close, moved lower early in the day, and remained in negative territory throughout the trading session. Selling pressure intensified during the final minutes of trading, pushing the index to close near the session low.
Although it was a weak trading day, the TSX continues to exhibit underlying strength. The index closed just above its 25-day moving average and remains comfortably above both its 50-day and 200-day moving averages, indicating that the longer-term trend remains constructive.
Friday’s TSX Market Statistics
Market breadth weakened on Friday, with declining issues outpacing advancing issues by a margin of 1,205 to 985, a decliner-to-advancer ratio of 1.22:1, or roughly six declining stocks for every five advancing stocks. An additional 111 issues closed unchanged, reflecting broad-based selling pressure across the market.
The deterioration in internal market strength was also evident in the new 52-week high/low statistics. The TSX recorded 44 new 52-week highs and 87 new 52-week lows, a notable reversal from Thursday’s 58 new highs and 33 new lows. As a result, the new high-to-new low ratio shifted from approximately 2:1 on Thursday to 1:2 on Friday, indicating that downside momentum expanded significantly during the session.
Trading activity increased sharply, with total TSX volume reaching 520.0 million shares, up approximately 26% from Thursday’s 411.4 million shares. The combination of higher trading volume, negative market breadth, and an increase in new 52-week lows suggests that Friday’s decline was accompanied by broader market participation, a sign that selling pressure was more widespread than in the previous session.
.
Friday’s Toronto TSX Market Wrap-Up Report
The S&P/TSX Composite Index closed lower on Friday, falling 279.70 points, or 0.79%, to finish at 35,226.14. The index opened below Thursday’s close and traded in negative territory throughout the session. Selling pressure intensified during the final half hour of trading, pushing the TSX to finish near its intraday low, reflecting a cautious tone heading into the weekend.
Despite Friday’s weakness, the broader technical picture remains constructive. The TSX closed just above its 25-day moving average while continuing to trade comfortably above both its 50-day and 200-day moving averages, suggesting that the intermediate- and long-term uptrends remain intact. However, Friday’s decline weakened short-term momentum, making the 25-day moving average an important support level to monitor during the coming week.
Sector Performance
Only two of the TSX’s ten major sectors finished higher on Friday. Healthcare led the market with a gain of 0.36%, followed by Financials, which edged up 0.14%. Industrials (-0.08%) and Energy (-0.09%) were little changed and narrowly missed ending the day in positive territory.
Consumer-related sectors also displayed relative resilience. Consumer Discretionary declined only 0.04%, while Consumer Durables & Services slipped 0.42%.
Defensive sectors failed to attract significant buying interest despite the broader market weakness. Telecommunications Services fell 0.65%, while Utilities declined 0.85%, suggesting investors were not aggressively rotating into traditional defensive holdings.
The weakest performance came from Technology (-2.66%) and Basic Materials (-2.74%), both of which weighed heavily on the broader index.
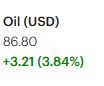
Friday’s decline effectively erased much of Thursday’s gains. Recent market direction continues to be influenced by fluctuations in crude oil prices, which have remained highly sensitive to ongoing geopolitical developments in the Middle East. As energy represents a significant weighting within the Canadian market, volatility in oil prices continues to affect overall TSX performance and investor sentiment.
Market Internals
Market breadth deteriorated noticeably on Friday. Declining issues outnumbered advancing issues by 1,205 to 985, producing a decliner-to-advancer ratio of 1.22:1, while 111 stocks closed unchanged. The negative breadth indicates that selling pressure extended well beyond a handful of large-cap stocks.
Internal market strength also weakened. The TSX recorded 44 new 52-week highs compared with 87 new 52-week lows. This represented a significant reversal from Thursday’s reading of 58 new highs versus only 33 new lows, shifting the new high-to-new low ratio from approximately 2:1 to 1:2 in a single trading session.
Trading activity increased substantially, with total TSX volume reaching 520.0 million shares, approximately 26% above Thursday’s 411.4 million shares. The combination of heavier volume, negative market breadth and an expansion in new 52-week lows suggests that Friday’s selling was broad-based and supported by increased market participation.
Financials
Canada’s major financial institutions delivered mixed performances.
Bank of Montreal gained 0.46%, followed by Canadian Imperial Bank of Commerce (+0.25%) and Toronto-Dominion Bank (+0.16%). Royal Bank of Canada declined 0.33%, while Manulife Financial slipped 0.22% and Bank of Nova Scotia eased 0.11%.
Leadership among individual stocks was broadly distributed across multiple industries. While mining companies remained represented among the day’s stronger performers, they did not dominate market leadership as they often do within the resource-heavy TSX.
Company Spotlight
Telus Corporation was one of Friday’s most actively traded and weakest-performing large-cap stocks. Shares plunged 11.27% to close at $13.38 after the company reported quarterly earnings that declined approximately 27% and announced a 55% reduction in its dividend.
More than 50.3 million shares changed hands during the session, roughly six times the stock’s 50-day average daily trading volume. The unusually heavy volume reflected a strong negative market reaction as investors adjusted expectations following the earnings release and dividend reduction.
Technical Outlook
Friday’s decline weakened near-term market momentum but has not yet altered the broader bullish trend. The TSX remains above its key intermediate- and long-term moving averages, indicating that buyers continue to control the larger trend despite recent volatility.
The 25-day moving average now represents the first important support level. A decisive break below this level could invite additional short-term profit-taking and increase the probability of a test of the 50-day moving average. Conversely, if buyers successfully defend current support, Friday’s decline may prove to be a normal pullback within the prevailing uptrend.
Key Takeaways for Traders and Investors
- Friday’s weakness was broad-based, with declining stocks, expanding new lows and heavier trading volume indicating increased selling participation.
- Financials continued to provide relative stability, while Technology and Basic Materials accounted for much of the market’s weakness.
- Investors showed little appetite for traditional defensive sectors, suggesting the decline reflected selective risk reduction rather than widespread defensive positioning.
- The TSX’s longer-term technical structure remains constructive as the index continues to trade above its 50-day and 200-day moving averages.
- Traders should closely monitor the 25-day moving average during the coming week. Holding above this level would support the view that the recent weakness represents a healthy consolidation. A decisive break below it would likely signal a deeper short-term correction.
.
The US Markets
Friday’s U.S. Market Indexes
U.S. equity markets extended their rebound on Friday, with three of the four major indexes posting gains for a second consecutive session. Technology shares continued to lead the advance, although small-cap stocks lagged.
The Dow Jones Industrial Average gained 276.97 points, or 0.53%, to close at 52,485.03. The S&P 500 advanced 52.09 points, or 0.70%, to finish at 7,489.72, while the Nasdaq Composite climbed 251.68 points, or 1.00%, to close at 25,373.85. In contrast, the Russell 2000 declined 14.76 points, or 0.50%, ending the session at 2,931.34.
Friday’s gains followed Thursday’s positive session, providing additional evidence that buying interest has returned to large-cap U.S. equities. Technology stocks once again led the market higher, helping the Nasdaq outperform the broader indexes.

Technical Outlook
From a technical perspective, the market showed further improvement, although the major indexes remain at different stages of their recoveries.
The S&P 500 continues to strengthen after successfully reclaiming its 25-day moving average. The index also remains comfortably above both its 50-day and 200-day moving averages, reinforcing the view that the intermediate- and long-term uptrend remains intact.
The Dow Jones Industrial Average also continues to display constructive technical strength, reflecting improving investor confidence in large-cap blue-chip stocks.
The Nasdaq Composite posted another strong advance, extending Thursday’s rebound. Despite the encouraging two-day rally, the index continues to recover from the technical damage sustained during the early July selloff. The Nasdaq has regained ground above its 200-day moving average but remains just below both its 25-day and 50-day moving averages. Until those resistance levels are decisively reclaimed, the technology sector’s recovery should be viewed as improving but not yet fully confirmed.
The Russell 2000 remains the weakest of the major indexes. Friday’s decline left the index below its 25-day moving average, although it continues to trade above both the 50-day and 200-day moving averages. This suggests that while the longer-term trend remains positive, short-term momentum has weakened.
Market Perspective
The tone of the U.S. market improved noticeably over the past two sessions, with gains becoming broader among large-cap stocks and investor sentiment showing signs of stabilization. However, the technical picture remains mixed. While the S&P 500 and Dow Jones Industrial Average continue to exhibit solid underlying strength, the Nasdaq has yet to fully repair the technical damage from July’s correction, and the Russell 2000 continues to underperform.
For now, the recent rebound should be viewed as an encouraging development rather than confirmation of a sustained new advance. Continued follow-through buying, accompanied by improving market breadth and the Nasdaq reclaiming its 25-day and 50-day moving averages, would provide stronger evidence that the recovery is becoming more durable.
Key Takeaways for Traders and Investors
- U.S. large-cap indexes recorded a second consecutive day of gains, with technology stocks once again leading the market higher.
- The S&P 500 and Dow Jones Industrial Average continue to display the strongest technical profiles among the major indexes.
- The Nasdaq’s recovery is gaining momentum, but confirmation requires a decisive move back above its 25-day and 50-day moving averages.
- The Russell 2000 remains the relative laggard, indicating that risk appetite has yet to broaden into smaller-cap stocks.
- The coming week’s price action will be important in determining whether the recent rebound develops into a sustained advance or proves to be another short-lived recovery rally.
Friday’s U.S. Market Statistics
New York Stock Exchange (NYSE): Market internals on the New York Stock Exchange weakened on Friday despite the gains recorded by the major U.S. equity indexes, indicating that the advance remained relatively narrow.
Declining issues outnumbered advancing issues by 2,347 to 2,115, producing a decliner-to-advancer ratio of 1.11:1, or approximately one declining stock for every advancing stock. An additional 495 issues closed unchanged.
The exchange recorded 151 new 52-week highs and 211 new 52-week lows, compared with 153 new highs and 144 new lows on Thursday. Consequently, the new high-to-new low ratio declined from 1.06:1 to 0.71:1, reflecting a deterioration in market leadership and internal strength.
Trading activity moderated slightly, with total NYSE volume reaching 5.50 billion shares, down approximately 4% from Thursday’s 5.73 billion shares. The combination of negative market breadth, more new lows than new highs, and slightly lighter trading volume suggests that although selling pressure broadened, it was not accompanied by a significant increase in overall market participation.
Overall, Friday’s NYSE internals indicate that the market’s underlying tone weakened even as the headline indexes advanced. While one trading session does not establish a new trend, traders should continue monitoring whether market breadth and new 52-week highs begin to improve over the coming sessions.
NASDAQ: NASDAQ market internals also remained negative despite the Nasdaq Composite posting its second consecutive daily gain.
Declining issues exceeded advancing issues by 2,664 to 2,177, resulting in a decliner-to-advancer ratio of 1.22:1, or roughly six declining stocks for every five advancing stocks. A further 406 issues closed unchanged, confirming that weakness remained widespread beneath the surface.
The exchange recorded 97 new 52-week highs and 235 new 52-week lows, compared with 120 new highs and 172 new lows on Thursday. As a result, the new high-to-new low ratio deteriorated further, indicating that market leadership weakened even as the Nasdaq Composite advanced.
At the same time, trading activity increased sharply. Total NASDAQ volume reached 12.23 billion shares, an increase of approximately 28% from Thursday’s 9.51 billion shares. This marked the second consecutive session of elevated trading volume, reflecting continued strong investor participation.
The divergence between the Nasdaq Composite’s price performance and its negative internal statistics suggests that buying remained concentrated in a relatively small group of large-cap technology stocks rather than being broadly distributed across the market. Such divergences are common during the early stages of market recoveries but require confirmation through improving market breadth and expanding new 52-week highs.
Market Perspective
Friday’s internal market statistics present a mixed picture. Although the major U.S. indexes extended their rebound, both the NYSE and NASDAQ continued to report negative breadth, with declining issues exceeding advancing issues and new 52-week lows outnumbering new highs.
This divergence indicates that the recent recovery has yet to broaden across the overall market. For a stronger technical confirmation of the rally, traders should look for improving advance-decline ratios, an expansion in new 52-week highs, and continued healthy trading volume over the coming sessions.
Key Takeaways for Traders and Investors
- The major U.S. indexes advanced for a second consecutive session, but market participation remained uneven.
- Both the NYSE and NASDAQ recorded negative advance-decline breadth, indicating that gains were concentrated in a relatively small number of stocks.
- New 52-week lows continued to outnumber new highs on both exchanges, suggesting that market leadership remains weak.
- NASDAQ trading volume increased for a second consecutive session, while NYSE volume eased modestly.
- The current rebound is encouraging, but broader participation will be needed before technicians can conclude that a more durable market advance is underway.
.
Friday’s U.S. Market Wrap-Up Report
U.S. equities extended their recovery on Friday, with three of the four major indexes posting gains for a second consecutive session. The Dow Jones Industrial Average, S&P 500 and Nasdaq Composite all finished higher, while the Russell 2000 declined 0.50%, reflecting continued weakness among small-cap stocks.
The Nasdaq once again led the advance, supported by renewed buying in large-cap technology shares. Although the two-day rally is encouraging, market internals remained mixed, suggesting that leadership continues to be concentrated in a relatively narrow group of stocks rather than broad-based across the market.
Sector Performance
Five of the major market sectors closed higher on Friday.
Consumer Discretionary was the clear leader, advancing 3.88% as retail-related companies outperformed. Energy gained 0.85%, supported by continued strength in crude oil prices despite signs that geopolitical tensions in the Middle East eased somewhat during the day. Technology added 0.39%, extending its recent rebound.
Industrials posted a modest gain of 0.03%, while Financials slipped 0.20%.
Healthcare declined 1.01%, and Basic Materials was the weakest-performing sector, falling 1.95%, reflecting continued pressure on commodity-related shares.
Market Internals
Although the headline indexes finished higher, underlying market participation remained less convincing.
On the New York Stock Exchange, declining issues outnumbered advancing issues, while new 52-week lows continued to exceed new highs. NASDAQ displayed a similar pattern, with declining stocks exceeding advancing stocks despite another strong gain in the Nasdaq Composite.
Trading activity remained elevated, particularly on the NASDAQ, where total volume increased for a second consecutive session. The divergence between stronger index performance and weaker market breadth suggests that buying remained concentrated in larger-cap technology companies rather than broadly distributed across the market.
While these internal statistics do not invalidate the current rebound, they indicate that broader market participation will be needed before technicians can conclude that a more durable advance is underway.
Technical Outlook
The technical outlook continues to improve but remains mixed across the major indexes.
The S&P 500 and Dow Jones Industrial Average continue to display constructive technical strength, holding above their key intermediate- and long-term moving averages.
The Nasdaq Composite has shown meaningful improvement over the past two sessions but continues to recover from the technical damage sustained during July’s correction. The index remains below its 25-day and 50-day moving averages, leaving additional work to be done before technicians can consider the recovery fully confirmed.
The Russell 2000 remains the weakest of the major indexes. Although it continues to trade above its 50-day and 200-day moving averages, it has slipped below its 25-day moving average, indicating weakening short-term momentum.
Risk Management Perspective
Recent market action serves as another reminder that preserving capital remains one of the most important principles of successful investing. During periods when many stocks remain technically impaired, patience and disciplined stock selection often provide a better risk-reward profile than aggressively chasing short-term rebounds.
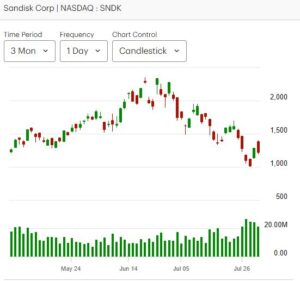
The sharp decline experienced by Sandisk over recent weeks illustrates how quickly technically weak stocks can lose value. While any stock can eventually recover, experienced traders generally look for evidence of a confirmed trend reversal before committing significant new capital. Waiting for technical confirmation may occasionally result in missing the exact bottom, but it can also reduce the risk of participating in prolonged downtrends.
Earnings Calendar
The earnings calendar remains active and is likely to influence market direction during the coming week.
Monday: Palantir Technologies (PLTR), Jazz Pharmaceuticals (JAZZ), ON Semiconductor (ON), and Vertex Pharmaceuticals (VRTX).
Tuesday: Booking Holdings (BKNG), Caterpillar (CAT), Astera Labs (ALAB), and Advanced Micro Devices (AMD). Caterpillar is scheduled to report before the market opens.
Wednesday: Western Digital and Sandisk are expected to report after the closing bell. Eli Lilly (LLY) and Shopify (SHOP) are also scheduled to release quarterly results.
Earnings season frequently produces sharp price movements and elevated trading volume. Traders should remain aware of reporting dates when establishing or managing positions, particularly in stocks with historically high post-earnings volatility.
Corporate Development
Artificial intelligence remained in focus following reports that Anthropic disclosed instances during internal evaluations. The incidents highlight the growing importance of AI safety, cybersecurity, and governance as increasingly capable AI systems are deployed in commercial settings.
As AI adoption accelerates, questions surrounding system accountability, operational safeguards, and regulatory oversight are likely to become increasingly important for technology companies, investors, and policymakers. We will continue to monitor developments in this rapidly evolving area and provide updates as new information becomes available.
Key Takeaways for Traders and Investors
- The major U.S. indexes extended their rebound, but market leadership remained concentrated in a relatively small group of stocks.
- Consumer Discretionary and Technology continued to lead the market, while Healthcare and Basic Materials lagged.
- Market breadth remained negative on both the NYSE and NASDAQ, suggesting that broader participation has yet to confirm the rally.
- The S&P 500 and Dow continue to display the strongest technical profiles, while the Nasdaq is improving but remains below important short-term resistance levels.
- An active earnings calendar is likely to drive stock-specific volatility throughout the coming week. Traders should monitor earnings announcements closely and continue emphasizing disciplined risk management until broader market participation strengthens.
.
NOTICE TO READERS
The Canadian Vanguard Stock Market is about empowering you to build and manage your wealth by yourself. There is certainly no magic in managing finances or wealth but one needs to know what to do and commit to doing what is needed. When you are ready to start the journey to Take Charge and Put Your Destiny In Your Own Hands, start with reading The Canadian Vanguard every market day. If and when you need more related information or to advertise your business products or services in The Canadian Vanguard, Contact Us
Our readers are strongly advised to conduct their own research into individual stocks before making a purchase decision. In addition, investors are advised that past stock performance is no guarantee of future price appreciation. Any recommendation is not a guarantee of any particular stock’s future prices, and The Canadian Vanguard accepts no responsibility or liability for investors’ or readers’ purchases.
Stocks In The News/ Stocks To Watch and Market Strategy will soon be available only to Paying Subscribers. The dollar sign “$” in the Toronto Market section in the articles only stands for Canadian dollar and in the US market section “$” stands for US dollar.
(c) This article is published by The Canadian Vanguard on August 1, 2026