







Markets Retreat as Oil Prices and Bond Yields Rise Following U.S. Threat of Total Economic War Against Iran
The Canadian Vanguard Stock Market Report Thursday August 20, 2026 Edition
.
The Toronto Market
Thursday Toronto Market Index
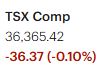
The S&P/TSX Composite Index slipped 36.37 points, or 0.10%, to close at 36,365.42.
The Toronto market, is A Canadian market based in Canada, but it is part of the broader North American market and does not operate in isolation. Today, the market reversed much of yesterday’s performance, as did several other North American markets. The session was bearish, with the TSX essentially giving back yesterday’s gain. The index declined 0.10% today, compared with yesterday’s 0.09% gain.
Despite the decline, the TSX’s internal market strength remained relatively solid. However, geopolitical conflicts outside North America continued to contribute to market volatility, even as underlying market conditions remained supportive.
Yesterday, the market benefited from declining bond yields following the U.S. Treasury’s announcement regarding increased debt purchases, which may help limit sharp declines in the indexes in the short term. Today, however, bond yields moved higher again. Rising oil prices and bond yields contributed to declines across North American stock markets.
Despite closing in negative territory, the TSX remains well above its 25-day, 50-day, and 200-day moving averages. This suggests that, while the market experienced a modest pullback today, its broader technical position remains strong.
.
Thursday’s TSX Market Statistics
At the TSX, declining issues (decliners) significantly outnumbered advancing issues (advancers). There were 1,488 decliners compared with 695 advancers, producing a decliner-to-advancer ratio of 2.14 to 1—approximately two declining issues for every advancing issue. Another 134 issues were unchanged.
The exchange recorded 61 new 52-week highs and 48 new 52-week lows, compared with 116 new 52-week highs and only 13 new 52-week lows yesterday. This represents a significant deterioration in the market’s new-high/new-low profile. The ratio of new 52-week highs to new 52-week lows was approximately 6:5 today, compared with 9:1 yesterday.
Market breadth was clearly negative and, by this measure, bearish. However, the broader market internals remained relatively positive. They appear somewhat stretched, but the underlying technical picture is still bullish. The sharp decline in new 52-week highs and the substantial increase in new 52-week lows are areas that warrant attention, particularly if this trend continues in the coming sessions.
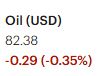
Geopolitical developments in the Middle East continued to exert a significant influence on the market. Oil prices rose today, while bond yields also moved higher. The 10-year and 30-year bond yields had declined yesterday but began climbing again today following comments from the U.S. administration earlier in the day regarding the possibility of an economic war with Iran. Concerns that escalating tensions could disrupt the free flow of oil through the Strait of Hormuz contributed to the rise in oil prices, while higher oil prices and renewed inflation concerns helped push bond yields higher.
Overall, Thursday’s market statistics point to negative market breadth and increased short-term volatility, while the broader market internals remain cautiously bullish. The deterioration in the new-high/new-low ratio, however, is an important warning sign that should be monitored closely.
Total trading volume on the TSX reached 440,248,990 shares, approximately 10% lower than the 483,906,185 shares traded yesterday.
.
Thursday’s Toronto TSX Market Wrap-Up Report
Thursday was a broadly negative and, by several measures, bearish trading session for the Toronto Stock Exchange. The S&P/TSX Composite Index declined 36.37 points, or 0.10%, to close at 36,365.42. The modest decline in the headline index, however, does not fully capture the weakness underneath the surface. Market breadth deteriorated significantly, while geopolitical developments, higher oil prices, and rising bond yields contributed to increased volatility.
Market Direction and Macro Environment
The TSX essentially reversed yesterday’s 0.09% gain, closing down 0.10% today. The Canadian market continued to be influenced by developments across the broader North American market, particularly movements in U.S. Treasury yields and geopolitical developments in the Middle East.
The 10-year and 30-year U.S. Treasury yields declined yesterday but began moving higher again today. Comments from the U.S. administration regarding the possibility of an economic war with Iran heightened concerns about disruptions to the flow of oil through the Strait of Hormuz. Oil prices consequently moved higher, while bond yields also climbed.
Higher oil prices provided support to the TSX Energy sector, but rising bond yields and broader geopolitical uncertainty weighed on other parts of the market. For traders and investors, the combination of higher oil prices, rising yields, and geopolitical uncertainty remains an important source of short-term market risk.
Sector Performance
Only four of the ten major TSX sectors finished higher on Thursday.
Basic Materials was the strongest-performing sector, gaining 1.57%. Energy followed with a 1.00% gain, benefiting from the rise in oil prices. Utilities advanced 0.37%, while Technology edged higher by 0.05%.
The weakness was concentrated in several major consumer and financial sectors. Financials declined 1.52%, while Durable Consumer Goods & Services fell 0.99%. Discretionary Consumer Goods & Services was the weakest major sector, falling 1.66%.
The divergence between Energy and Basic Materials on one side and Financials and consumer-related sectors on the other highlights the defensive and commodity-driven character of Thursday’s trading session.
Market Breadth Turns Bearish
The underlying market statistics were considerably weaker than the 0.10% decline in the TSX Composite might suggest.
There were 1,488 declining issues compared with only 695 advancing issues, producing a decliner-to-advancer ratio of 2.14 to 1. In practical terms, there were roughly two declining stocks for every advancing stock. Another 134 issues were unchanged.
This represents clearly negative market breadth and is a bearish short-term signal.
The new 52-week high/low statistics also deteriorated substantially. The TSX recorded 61 new 52-week highs and 48 new 52-week lows, compared with 116 new highs and only 13 new lows yesterday.
The resulting new-high-to-new-low ratio was approximately 6:5, a dramatic deterioration from yesterday’s 9:1 ratio. The decline in new highs and sharp increase in new lows suggest that participation beneath the index level has weakened.
Despite this deterioration, the broader market internals remain relatively positive and technically bullish, although somewhat stretched. The key issue for traders is whether Thursday’s deterioration is simply a short-term reaction to geopolitical and macroeconomic developments or the beginning of a more sustained deterioration in market breadth.
Trading Volume
Total TSX volume reached 440,248,990 shares, approximately 10% below the 483,906,185 shares traded on Wednesday.
The lower volume means that Thursday’s decline was not accompanied by a major surge in selling activity. Nevertheless, the combination of negative breadth, a sharply weaker new-high/new-low ratio, and lower overall volume warrants close monitoring in the coming sessions.
Precious Metals Continue to Lead
Gold and silver mining stocks again dominated the strongest performers on the TSX.
Among the top 25 TSX stocks by performance, the top twelve were gold and silver mining companies. These stocks not only gained but several advanced by at least 4%, reflecting continued investor interest in precious metals amid geopolitical uncertainty and elevated market risk.
Sprott Inc. (SII) was among the notable performers, advancing 4.4% to close at approximately $174.11, with about 1.3 million shares traded.
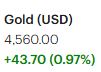
The continued strength in precious metals and mining stocks suggests that investors are seeking exposure to commodities and potential safe-haven assets while geopolitical uncertainty remains elevated.
Technical Perspective
Despite Thursday’s decline, the TSX Composite remains comfortably above its 25-day, 50-day, and 200-day moving averages. From a broader technical perspective, this remains constructive.
However, traders should distinguish between the strength of the index itself and the deterioration occurring beneath the surface. The index remains technically strong, but the sharp weakening in market breadth and the new-high/new-low ratio indicate that fewer stocks are participating in the advance.
This divergence deserves attention. If the TSX remains above its major moving averages while breadth recovers, the current weakness could prove to be only a temporary consolidation. Conversely, continued deterioration in breadth, increasing new lows, and a sustained move toward or below key moving averages would provide a more meaningful warning of a broader market correction.
Key Takeaways for Traders and Investors
- The headline index remains technically strong: The TSX is still above its 25-day, 50-day, and 200-day moving averages despite Thursday’s decline.
- Market breadth is bearish: Decliners outnumbered advancers by more than 2 to 1, indicating considerably broader weakness than the 0.10% index decline suggests.
- The new-high/new-low picture deteriorated sharply: The ratio fell from 9:1 yesterday to approximately 6:5 today. This is one of the most important statistics to monitor in the next several sessions.
- Energy and Basic Materials remain areas of relative strength: Rising oil prices and continued strength in precious metals are supporting commodity-related stocks.
- Financials and consumer sectors were weak: The 1.52% decline in Financials and 1.66% decline in Discretionary Consumer Goods & Services demonstrate that weakness was concentrated in important areas of the market.
- Geopolitical risk remains a major market driver: Developments involving Iran, the Strait of Hormuz, oil prices, and bond yields could continue to produce sharp intraday swings.
- Rising bond yields remain a risk: Higher 10-year and 30-year yields can put pressure on equity valuations and interest-sensitive sectors.
- Do not confuse a strong index with uniformly strong stocks: The TSX remains above its major moving averages, but the deterioration in breadth suggests that traders should pay close attention to individual stock leadership rather than relying solely on the index.
- Risk management is increasingly important: In an environment of geopolitical uncertainty and rapidly changing oil prices and bond yields, traders and investors should be prepared for larger-than-normal market swings and adjust position sizes and exposure accordingly.
Bottom Line
Thursday’s session was bearish beneath the surface, even though the TSX Composite declined by only 0.10%. The index remains in a technically constructive position, but the deterioration in market breadth and the sharp change in the new-high/new-low ratio are warning signs that should not be ignored.
For now, the market can be characterized as technically bullish but with increasingly bearish short-term internals. Traders should watch the TSX’s major moving averages, market breadth, new 52-week highs and lows, oil prices, and the 10-year and 30-year Treasury yields closely.
The next few trading sessions will be important in determining whether Thursday’s weakness represents a temporary geopolitical-driven pullback or the early stages of a broader market correction. In either case, maintaining disciplined risk management and remaining flexible will be particularly important in the current environment.
.
The US Markets
Thursday’s U.S. Market Indexes
All four major U.S. market indexes closed sharply lower on Wednesday, reversing yesterday’s move back toward bullish territory. The sell-off was broad-based, with all four major indexes declining by roughly 1% or more.
The Dow Jones Industrial Average fell 703.84 points, or 1.32%, to close at 52,759.21. The S&P 500 declined 66.82 points, or 0.87%, finishing at 7,641.16. The Nasdaq Composite dropped 263.92 points, or 1.00%, to close at 26,067.17. The Russell 2000 was the weakest of the four major indexes, plunging 40.51 points, or 1.34%, to finish at 2,992.75.

A Significant Reversal
The most notable feature of Wednesday’s session was not simply that the indexes closed in the red, but that the Dow and Russell 2000 declined by more than 1%, while the Nasdaq also fell 1.00%. This represents a meaningful one-day reversal following yesterday’s improvement.
Does this mark the beginning of a new bearish trend?
It is too early to make that determination. One trading session does not establish a trend. Traders and investors should wait for confirmation through subsequent sessions, particularly by monitoring market breadth, trading volume, bond yields, and whether the major indexes remain above their key moving averages.
The steep sell-off was largely associated with Treasury yields moving higher again. The rise in yields was influenced by several factors, including continued geopolitical tensions in the Middle East and renewed concerns about the potential economic consequences of escalating tensions.
Russell 2000 Shows Particular Weakness
Small-cap stocks were among the hardest hit on Wednesday. The Russell 2000 declined 1.34%, closing at 2,992.75 and slipping back below the psychologically important 3,000 level.
The move below 3,000 is noteworthy because the Russell 2000 had crossed above that level several months ago and had not closed below it since. The index is now down approximately 2.3% for the week.
Unless the market reverses course on Thursday, the Russell 2000 could be heading toward an end to its impressive three-week winning streak.
For traders, the Russell 2000 is particularly important because small-cap stocks can provide an indication of investors’ appetite for risk. Continued weakness in the Russell could therefore be an early warning sign of broader risk reduction across the equity market.
Technical Position Remains Constructive
Despite Wednesday’s sharp decline, the broader technical picture has not yet turned decisively bearish.
The Nasdaq Composite, S&P 500, and Russell 2000 remain well above their 25-day, 50-day, and 200-day moving averages. This means that, from a moving-average perspective, the indexes continue to maintain a relatively strong intermediate- and longer-term technical structure.
However, the sharp one-day decline and the Russell 2000’s loss of the 3,000 level deserve close attention. A continuation of selling pressure could begin to change the technical picture, particularly if the indexes start breaking below their shorter-term moving averages.
Key Takeaway for Traders and Investors
Wednesday’s sell-off is a warning, but not yet confirmation of a bearish trend.
The combination of rising Treasury yields, geopolitical uncertainty, and broad-based selling creates a challenging short-term environment. Traders should avoid making major directional decisions based solely on Wednesday’s decline. Instead, the focus should be on whether selling continues, whether the indexes hold their major moving averages, and whether the Russell 2000 can reclaim the 3,000 level.
For now, the U.S. market can best be described as technically bullish but experiencing a significant short-term setback. The next several trading sessions should provide much more information about whether Wednesday was simply a sharp pullback or the beginning of a more meaningful bearish reversal.
Thursday’s U.S. Market Statistics
Thursday’s market statistics show a clear deterioration in market breadth and a significant weakening in the underlying internals of both the NYSE and Nasdaq. While the major indexes declined sharply, the trading volume data do not indicate widespread panic selling. The more important development was the deterioration in the new-high/new-low picture and the return of broadly negative market breadth.
New York Stock Exchange (NYSE): At the New York Stock Exchange, declining issues substantially outnumbered advancing issues. There were 2,979 decliners, 1,534 advancers, and 535 unchanged issues, producing a decliner-to-advancer ratio of 1.94 to 1—approximately two declining stocks for every advancing stock.
Market breadth was therefore clearly negative and bearish.
The deterioration was also evident in the 52-week high/low statistics. The NYSE recorded 156 new 52-week highs and 132 new 52-week lows, compared with 263 new highs and 93 new lows yesterday.
The number of new highs declined by approximately 41%, while new lows increased by approximately 42%. Consequently, the new-high-to-new-low ratio deteriorated from approximately 3:1 yesterday to 6:5 today.
This is a significant change in market conditions. Although the broader NYSE internals can still be described as relatively bullish, they are considerably weaker than they were yesterday. The sharp deterioration in the high/low ratio is something traders should monitor closely in the next several sessions.
NYSE Trading Volume
Total NYSE volume reached 4,905,918,764 shares, approximately 7% lower than the 5,272,044,863 shares traded yesterday.
The combination of lower volume and a declining market is noteworthy. While stocks declined broadly, the reduction in volume does not suggest panic selling or capitulation. At this point, the data appear more consistent with a broad market pullback than an indiscriminate rush for the exits.
NASDAQ: The Nasdaq showed even weaker breadth. There were 3,217 decliners compared with 1,672 advancers, producing a decliner-to-advancer ratio of 1.92 to 1. Another 432 issues were unchanged.
This represents clearly bearish market breadth, with nearly two declining stocks for every advancing stock.
The 52-week high/low statistics also deteriorated sharply. The Nasdaq recorded 109 new 52-week highs and 138 new 52-week lows, compared with 206 new highs and 128 new lows yesterday.
New highs fell by approximately 47%, while new lows increased modestly. As a result, the new-high-to-new-low ratio deteriorated to approximately 4:5, compared with roughly 3:2 yesterday.
The message from these statistics is clear: the Nasdaq’s internal strength weakened substantially today. Yesterday’s bullish market internals were followed by a sharp reversal, demonstrating just how quickly market conditions can swing between extremes in the current environment.
However, the deterioration should be kept in perspective. The Nasdaq’s internals are bearish today, but the data do not yet represent the kind of extreme deterioration that would by themselves confirm a major market breakdown.
Nasdaq Trading Volume
Total Nasdaq trading volume was 8,538,067,615 shares, essentially unchanged from yesterday’s 8,532,265,158 shares.
This is an important observation. The Nasdaq declined broadly today, but trading volume was virtually identical to yesterday’s level. Therefore, despite the bearish price action and negative breadth, there is no clear evidence of panic selling.
The market was bearish, but investors were not rushing indiscriminately for the exits.
.
Key Takeaway for Traders and Investors
Thursday’s statistics confirm that the U.S. market experienced a broad-based deterioration beneath the surface.
- NYSE breadth was bearish: 1.94 decliners for every advancer.
- Nasdaq breadth was also bearish: 1.92 decliners for every advancer.
- NYSE new highs fell sharply: from 263 to 156.
- NYSE new lows increased: from 93 to 132.
- Nasdaq new highs dropped almost 50%: from 206 to 109.
- Nasdaq new lows increased: from 128 to 138.
- NYSE volume declined 7%, despite the market moving lower.
- Nasdaq volume was essentially unchanged, despite the decline.
- There is no obvious evidence of panic selling based on volume alone.
- The most important warning sign is the rapid deterioration in market breadth and the new-high/new-low ratios.
The market has clearly shifted from yesterday’s stronger bullish internal picture toward a more defensive and bearish short-term environment. However, traders should not conclude that a new major bearish trend has begun based on one session of statistics.
The next few sessions will be important. If negative breadth persists, new lows continue to expand, and the major indexes begin breaking below their key moving averages, the bearish signal would become considerably stronger. Conversely, a quick recovery in breadth and a rebound in new highs would suggest that Thursday’s weakness was more likely a sharp but temporary pullback.
For now, the appropriate stance is caution rather than panic. The market internals have weakened significantly, but the absence of a major volume surge suggests that the selling has not yet reached capitulation levels.
.
Thursday’s U.S. Market Wrap-Up Report
Thursday was a difficult trading session for U.S. equities. All four major market indexes closed lower, confirming the broadly negative tone of the session. The Dow Jones Industrial Average, S&P 500, Nasdaq Composite, and Russell 2000 all finished in the red, with the Dow and Russell 2000 declining by more than 1%.
The broader market environment was also affected by the renewed rise in oil prices and long-term Treasury yields. After bond yields declined yesterday, they reversed direction and moved higher again today. The combination of higher yields, geopolitical uncertainty, and rising oil prices created a challenging environment for equities.
Market Indexes
The Dow Jones Industrial Average declined 703.84 points, or 1.32%, to close at 52,759.21.
The S&P 500 fell 66.82 points, or 0.87%, finishing at 7,641.16.
The Nasdaq Composite dropped 263.92 points, or 1.00%, to close at 26,067.17.
The Russell 2000 was the weakest major index, falling 40.51 points, or 1.34%, to close at 2,992.75.
The Russell 2000’s close below the psychologically important 3,000 level is particularly noteworthy. The index had moved above 3,000 several months ago and had not closed below that level since. It is now down approximately 2.3% for the week and could end its strong three-week winning streak if the market does not recover on Friday.
Despite Thursday’s decline, the S&P 500, Nasdaq Composite, and Russell 2000 remain above their 25-day, 50-day, and 200-day moving averages. Therefore, the broader technical picture has not yet turned decisively bearish.
.
Market Breadth Turns Clearly Negative
The underlying market statistics were considerably weaker than the headline index declines alone suggest.
At the NYSE, there were 2,979 decliners versus 1,534 advancers, producing a decliner-to-advancer ratio of 1.94 to 1. At the Nasdaq, 3,217 stocks declined compared with 1,672 advancers, producing a ratio of 1.92 to 1.
In other words, approximately two stocks declined for every stock that advanced on both exchanges. Market breadth was therefore clearly negative and bearish.
The new-high/new-low statistics also deteriorated significantly.
At the NYSE, new 52-week highs fell from 263 yesterday to 156 today, while new lows increased from 93 to 132. The new-high-to-new-low ratio consequently deteriorated from approximately 3:1 yesterday to 6:5 today.
The Nasdaq experienced an even more pronounced deterioration. New 52-week highs dropped from 206 to 109, while new lows increased from 128 to 138. The resulting new-high-to-new-low ratio was approximately 4:5.
This sharp reversal in market internals is an important warning sign. However, it does not, by itself, establish that a new long-term bearish trend has begun. One trading session is insufficient to establish a trend, and traders should look for confirmation over the next several sessions.
No Evidence of Panic Selling Yet
Trading volume provides an important piece of the picture.
NYSE volume reached approximately 4.91 billion shares, about 7% below yesterday’s 5.27 billion shares.
Nasdaq volume was approximately 8.54 billion shares, essentially unchanged from yesterday’s 8.53 billion shares.
The fact that the indexes declined while Nasdaq volume remained virtually unchanged, and NYSE volume actually decreased, suggests that Thursday’s selling did not represent obvious panic or capitulation.
The market was broadly bearish, but investors were not rushing for the exits in extraordinary volume.
Sector Performance
Five of the eleven major U.S. sectors finished higher on Thursday, but the gains in several sectors were not enough to offset the weakness in the broader market.
Healthcare was the strongest sector, advancing 3.28%. Basic Materials followed with a gain of 3.09%.
Discretionary Consumer Goods & Services rose 1.93%, while Durable Consumer Goods & Services gained 0.82%.
The Energy sector declined 0.20%, despite the rise in oil prices. Technology and Financials fell 0.40% and 0.84%, respectively.
Industrials, down 1.19%, was the weakest major sector.
The sector performance demonstrates that Thursday was not a uniform sell-off across every industry. Healthcare and Basic Materials showed considerable relative strength, while Industrials, Financials, and Technology were among the weaker areas.
.
Moderna Takes Profit After Wednesday’s Surge
Moderna (MRNA) was again one of the most closely watched stocks following its extraordinary 176% surge on Wednesday.
Thursday brought a sharp reversal as investors took profits following Wednesday’s massive advance. Moderna declined approximately 20% in heavy trading, with roughly 100 million shares changing hands.
The price action provides a useful reminder for traders: extraordinary one-day gains can be followed by equally extraordinary volatility as early investors lock in profits and short-term traders reposition.
.
AI and Optoelectronics Stocks Recover
AI-related stocks recovered to some extent Thursday, while the optoelectronics industry group also showed renewed strength.
Lumentum (LITE) led the group, gaining 6.24% to close at $879.28, with approximately 4.3 million shares traded.
Applied Optoelectronics Inc. (AAOI) advanced 5.66%, closing at $129.10 on approximately 9.5 million shares.
Coherent Corp. (COHR) gained 0.91%, closing at $290.10, with approximately 5.0 million shares traded.
The relative strength in these stocks is worth monitoring because optoelectronics companies have exposure to the continuing demand for AI infrastructure, data centers, optical networking, and high-speed communications technology.
Key Takeaways for Traders and Investors
- Thursday was a clearly negative session: All four major U.S. indexes closed lower.
- Small caps showed particular weakness: The Russell 2000 fell 1.34% and closed below 3,000 for the first time in several months.
- Market breadth turned bearish: Both the NYSE and Nasdaq had approximately two decliners for every advancing stock.
- Market internals deteriorated sharply: New 52-week highs fell substantially while new lows increased.
- The technical picture is not yet decisively bearish: The S&P 500, Nasdaq, and Russell 2000 remain above their major moving averages.
- There was no clear panic selling: NYSE volume declined while Nasdaq volume was essentially unchanged.
- Bond yields and oil prices remain important market drivers: Further increases could continue to pressure equity valuations.
- Healthcare and Basic Materials showed strong relative strength, while Industrials, Financials, and Technology were weaker.
- AI and optoelectronics stocks showed renewed strength, led by Lumentum and Applied Optoelectronics.
- Moderna demonstrated the extreme volatility surrounding momentum stocks: After gaining 176% Wednesday, the stock fell approximately 20% Thursday on very heavy volume.
Bottom Line
Thursday’s session was a significant deterioration from yesterday’s more bullish market conditions, particularly when viewed through the lens of market breadth and new 52-week highs and lows.
However, it would be premature to declare that the U.S. market has entered a new bearish trend. The major indexes remain above their important moving averages, and the lack of a major increase in trading volume suggests that Thursday’s decline was not accompanied by widespread panic selling.
For traders, the Russell 2000’s break below 3,000, the deterioration in market breadth, and the sharp decline in new highs deserve particular attention. If these conditions persist or worsen, the bearish case will become stronger. Conversely, a recovery in breadth, renewed expansion in new highs, and stabilization in Treasury yields would suggest that Thursday’s sell-off was a correction rather than the beginning of a larger market decline.
The appropriate approach at this point is caution, not panic. Traders should remain flexible, manage position sizes carefully, and watch for confirmation before making major changes to their market outlook.
.
NOTICE TO READERS
The Canadian Vanguard Stock Market is about empowering you to build and manage your wealth by yourself. There is certainly no magic in managing finances or wealth but one needs to know what to do and commit to doing what is needed. When you are ready to start the journey to Take Charge and Put Your Destiny In Your Own Hands, start with reading The Canadian Vanguard every market day. If and when you need more related information or to advertise your business products or services in The Canadian Vanguard, Contact Us
Our readers are strongly advised to conduct their own research into individual stocks before making a purchase decision. In addition, investors are advised that past stock performance is no guarantee of future price appreciation. Any recommendation is not a guarantee of any particular stock’s future prices, and The Canadian Vanguard accepts no responsibility or liability for investors’ or readers’ purchases.
Stocks In The News/ Stocks To Watch and Market Strategy will soon be available only to Paying Subscribers. The dollar sign “$” in the Toronto Market section in the articles only stands for Canadian dollar and in the US market section “$” stands for US dollar.
(c) This article is published by The Canadian Vanguard on August 20, 2026



