







Dow Leads Wall Street Higher as Oil Prices Ease and More Tech Earnings Loom
The Canadian Vanguard Stock Market Report – Tuesday October 20, 2026 Edition
.
The Toronto Market
Tuesday’s Toronto Market Index
The S&P/TSX Composite Index rose 179.33 points, or 0.50%, to close at 36,107.96 on Tuesday.


The TSX has returned to an alternating pattern of gains and losses. After falling 0.69% on Monday, the index recovered most, but not all, of those losses in Tuesday’s session.
Last week was particularly difficult for the stock market, with Friday standing out as an especially poor session. Nevertheless, the TSX continues to demonstrate resilience for now.
From a technical perspective, the index has moved back above its 25-day moving average and is trading just above its 50-day moving average. It also remains comfortably above its 200-day moving average, a positive sign for the broader trend.
Trading above the 50-day moving average can help strengthen investor confidence, as it suggests the market is maintaining its medium-term upward momentum. However, the TSX will need to sustain these levels to confirm that its recent strength can continue.
Tuesday’s TSX Market Statistics
Market breadth on the Toronto Stock Exchange (TSX) was positive on Tuesday, with advancing issues comfortably outnumbering declining issues. There were 1,334 advancers and 894 decliners, producing an advancer-to-decliner ratio of 1.49 to 1. In other words, approximately three stocks advanced for every two that declined. Another 118 issues remained unchanged.
The exchange recorded 87 new 52-week highs and 77 new 52-week lows, compared with 55 new highs and 59 new lows on Monday.
The number of new 52-week highs increased by approximately 58% from the previous session, while the number of new lows rose by about 31%. More importantly, new highs outnumbered new lows by 10, representing an improvement in this market-strength indicator. This was a relatively encouraging performance compared with recent sessions.
On Friday, new 52-week highs also exceeded new 52-week lows. Together with Tuesday’s figures, this suggests that the TSX’s internal market indicators are showing signs of improvement. However, the relatively small margin between new highs and new lows indicates that investors should continue to monitor market breadth closely.
Trading volume also increased significantly. A total of 404,027,459 shares changed hands on Tuesday, approximately 11.7% more than the 361,727,609 shares traded on Monday. The higher volume, combined with positive market breadth and the increase in new 52-week highs, provides some encouraging evidence of underlying market strength.
Nevertheless, the TSX appears to have returned to an alternating pattern of gains and losses. Despite the improving internal indicators, investors should continue to exercise caution and avoid assuming that the market has established a sustained upward trend.
Tuesday’s Toronto Stock Market (TSX) Wrap-Up Report
Market Overview: TSX Rebounds as Market Breadth Improves
The S&P/TSX Composite Index advanced 179.33 points, or 0.50%, on Tuesday to close at 36,107.96, recovering most of Monday’s 0.69% decline. Although the index has returned to an alternating pattern of gains and losses, Tuesday’s session provided some encouraging signs that underlying market conditions may be improving.
Market breadth was positive, with 1,334 advancing issues against 894 declining issues, producing an advancer-to-decliner ratio of 1.49 to 1. Another 118 issues were unchanged. Trading volume also increased to approximately 404 million shares, up about 11.7% from Monday’s 362 million shares.
Nine of the ten major sectors finished higher, indicating that Tuesday’s advance was relatively broad-based rather than driven by just a handful of stocks. Technology led the gains, rising 1.59%, followed by Financials, up 0.98%, and Telecommunications Services, which gained 0.97%. Consumer Discretionary Goods & Services advanced 0.75%, while Consumer Durables & Services rose 0.32%.
Basic Materials was the only sector to finish in negative territory, slipping 0.33%.
From a technical perspective, the TSX moved back above its 25-day moving average and edged above its 50-day moving average. The index also remains comfortably above its 200-day moving average, suggesting that the longer-term trend remains constructive. However, traders should watch whether the index can sustain its position above the 50-day moving average and build on Tuesday’s recovery.
Banking and Financial Stocks: All Six Major Banks Advance
Canadian bank stocks participated in Tuesday’s rebound, with all six of the country’s largest publicly traded banks closing higher.
Toronto-Dominion Bank (TD) led the group, gaining 1.24%. Royal Bank of Canada (RY) followed with a 0.96% advance, while Canadian Imperial Bank of Commerce (CM) rose 0.92%. Bank of Nova Scotia (BNS) gained 0.91%, National Bank of Canada (NA) advanced 0.50%, and Bank of Montreal (BMO) added 0.38%.
The broad advance among the major banks was encouraging, particularly as Financials gained 0.98% and ranked among Tuesday’s stronger sectors. Because banks carry substantial weight in the Canadian equity market, continued strength in this group could help support the TSX’s recovery.
Manulife Financial Corp. (MFC), another important financial-sector constituent, gained 0.43% to close at $62.53, with approximately 3.6 million shares traded.
For traders, the next point to watch is whether the banking sector can maintain its momentum over subsequent sessions. One positive session is encouraging, but sustained advances and healthy trading volume would provide stronger confirmation.
Company News and Stocks to Watch
Precision Drilling Corp. (PD): Strong Advance Following Analyst Upgrades
Precision Drilling Corp. (PD) was one of Tuesday’s notable performers, advancing 4.65% to close at $128.46 on approximately 168,000 shares traded.
The stock benefited from analyst upgrades and a higher price target. TD Cowen upgraded Precision Drilling to Buy from In-Line, while TD Securities raised its price target from $116 to $150.
The upgrades provide a positive catalyst for the stock, although analyst opinions and price targets are not guarantees of future performance. Traders should watch whether Tuesday’s advance attracts follow-through buying and whether trading volume expands. Investors considering a position should also evaluate the company’s fundamentals, valuation, debt profile, and exposure to the oil and gas drilling cycle.
Aritzia Inc. (ATZ): Investor Day on the Calendar
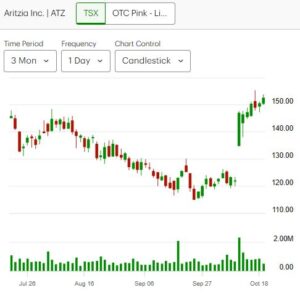
Aritzia Inc. (ATZ), a prominent Canadian apparel retailer, is scheduled to hold an Investor Day on Tuesday, October 27, according to the company announcement referenced in the draft.
The event is expected to feature members of senior management presenting the company’s strategic growth plan, key initiatives, and long-term financial outlook.
For investors, the event could provide additional insight into Aritzia’s growth strategy and management’s expectations for the business. Traders may wish to monitor the stock for changes in volume, volatility, and price direction as the event approaches.
Investors should review the company’s official announcement to confirm the event date and details before making decisions based on the upcoming catalyst.
Thomson Reuters Corp. (TRI): A Stock to Keep on the Watchlist
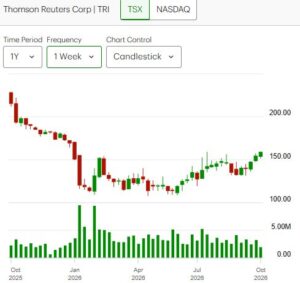
Thomson Reuters Corp. (TRI) remains a stock worth monitoring for investors seeking exposure to information services, professional software, and data-driven business solutions.
The stock has demonstrated periods of relative stability, making it a candidate for further technical and fundamental analysis. A potential recovery toward levels seen approximately a year ago may interest investors, but that scenario needs to be assessed against the current price, recent trading pattern, earnings outlook, and valuation.
Rather than assuming that the stock will return to its previous price, traders should look for evidence of improving price momentum, a developing base, or a breakout supported by stronger volume. Long-term investors should also consider the company’s growth prospects and whether its current valuation offers an attractive entry point.
Market Internals: Signs of Improvement, but Confirmation Is Still Needed
Tuesday’s market statistics offered additional evidence of improving internal strength.
The TSX recorded 87 new 52-week highs and 77 new 52-week lows, compared with 55 new highs and 59 new lows on Monday. The number of new highs increased by approximately 58%, while new lows rose by approximately 31%.
Although both figures increased, new highs outnumbered new lows by 10. This was an improvement from Monday, when new lows exceeded new highs by four. New highs also exceeded new lows on Friday, providing another encouraging data point.
The improvement in market breadth, the higher trading volume, and the positive balance between new highs and new lows suggest that participation in the market advance may be strengthening.
Nevertheless, the margin between new highs and new lows remains relatively narrow. Traders should look for continued improvement in these indicators before treating the latest rebound as evidence of a sustained market-wide uptrend.
Key Takeaways for Traders and Investors
1. The TSX recovery is encouraging, but confirmation matters.
The index recovered most of Monday’s decline and moved back above its 25-day and 50-day moving averages. Traders should monitor whether it can hold above these levels. A failure to maintain that position could signal that the rebound is losing momentum.
2. Positive market breadth supports the bullish case.
Advancers outnumbered decliners by approximately 1.49 to 1, and nine of ten sectors advanced. These are constructive signals, but their significance will increase if positive breadth persists over several sessions.
3. Financials and technology deserve attention.
Technology was Tuesday’s strongest sector, while Financials also performed well. Continued strength in these groups could help support the broader index. Traders should monitor sector leadership to determine whether the advance is broadening or narrowing.
4. Higher volume is encouraging, but price follow-through is essential.
Trading volume rose approximately 11.7% from Monday. This indicates greater trading activity, but volume alone does not establish whether the market’s advance is sustainable. The combination of rising prices, positive breadth, and continued participation over subsequent sessions would provide stronger confirmation.
5. Treat individual stock catalysts as opportunities for research, not automatic buy signals.
Precision Drilling’s analyst upgrades, Aritzia’s upcoming Investor Day, and Thomson Reuters’ potential technical recovery each provide reasons to investigate further. Before entering a position, traders and investors should consider valuation, liquidity, risk exposure, and appropriate exit levels.
6. Maintain disciplined risk management.
Despite the improving technical picture, the TSX has recently experienced alternating sessions of gains and losses. Investors should avoid assuming that a single positive session marks the beginning of a sustained rally. Position sizing, diversification, and clearly defined risk limits remain important.
Overall Assessment
Tuesday’s session was constructive for the Toronto stock market. The TSX advanced 0.50%, nine of ten sectors closed higher, advancing issues outnumbered declining issues, and trading volume increased. The index also regained its position above its 25-day and 50-day moving averages while remaining above its 200-day moving average.
The improving market internals provide additional reasons for cautious optimism. However, the recent pattern of alternating gains and losses suggests that the market has not yet established a clear, sustained upward trajectory.
For traders, the priority is to watch for follow-through buying, sustained support above the 50-day moving average, and continued improvement in market breadth. For longer-term investors, the current environment favours selectivity, fundamental research, and disciplined entry points rather than chasing short-term rebounds.
The message for now is cautiously optimistic: the TSX is showing signs of resilience, but further confirmation is needed before declaring that a more durable advance is underway.
.
The US Market
Tuesday’s U.S. Market Indexes: Dow and Small-Caps Rebound, Nasdaq Remains Under Pressure
Market Overview: A Mixed Session with a Strong Rotation Toward the Dow and Small-Caps
The major U.S. stock market indexes finished Tuesday’s session mixed, as strength in the Dow Jones Industrial Average and Russell 2000 contrasted with weakness in the Nasdaq Composite.
The Dow Jones Industrial Average advanced 529.85 points, or 1.02%, to close at 52,495.88, ending a two-session losing streak. The S&P 500 gained 21.84 points, or 0.28%, to finish at 7,712.57. Meanwhile, the Nasdaq Composite edged down 6.07 points, or 0.02%, to close at 26,424.82.
The Russell 2000 was the session’s strongest performer, jumping 45.12 points, or 1.65%, to finish at 2,773.42. The rebound was particularly notable because small-cap stocks had been among the weaker performers in the previous session.
Tuesday’s trading reflected a divergence in market leadership. The Dow and small-cap stocks advanced strongly, while technology-related weakness continued to weigh on the Nasdaq. The S&P 500 managed a modest gain but remains vulnerable to renewed selling pressure if its major technology constituents continue to underperform.
Declining oil prices helped support the Dow’s advance, easing some of the pressure associated with elevated energy costs and broader economic concerns. However, the improvement in the broader market was uneven, and the Nasdaq’s inability to advance suggests that investors remain selective.
Technology and Semiconductor Stocks Continue to Weigh on the Nasdaq
Technology stocks remained a source of weakness, particularly semiconductor companies and businesses associated with artificial intelligence infrastructure. Semiconductor shares experienced further selling on Tuesday, although the pressure was considerably less severe than during Monday’s session.
The Nasdaq Composite is especially sensitive to developments in technology because of its substantial exposure to technology-oriented and growth companies. Continued weakness in semiconductor and AI infrastructure stocks can therefore weigh disproportionately on the index.
The S&P 500 is also exposed to this risk because several large technology companies carry substantial index weightings. If these stocks continue to struggle, the broader market could experience difficulty sustaining its advance, even when other sectors perform well.
For traders, the key question is whether Tuesday’s relative stabilization in semiconductor stocks represents the beginning of a recovery or merely a pause in the recent selling. A sustained improvement in technology-sector performance would help strengthen the broader market outlook. Without that improvement, the Nasdaq may continue to lag behind the Dow and other less technology-heavy areas of the market.
Technical Analysis: Moving Averages Reveal Diverging Market Trends. The major indexes are showing different technical conditions, making index selection and risk management particularly important for traders.
S&P 500: Short-Term Weakness Within a Longer-Term Uptrend
The S&P 500 remains below its 25-day moving average but is trading just above its 50-day moving average. It continues to hold comfortably above its 200-day moving average.
This configuration suggests that short-term momentum has weakened, while the intermediate- and longer-term trends have not yet deteriorated to the same extent. The 50-day moving average is an important level to monitor because a sustained break below it could signal further deterioration in the market’s technical condition.
For now, the index remains in a potentially vulnerable position. Continued weakness in heavily weighted technology stocks could increase the risk of a broader pullback.
Nasdaq Composite: Elevated Risk of Continued Underperformance
The Nasdaq Composite is trading below both its 25-day and 50-day moving averages. This indicates that its short-term and intermediate-term momentum are weaker than those of an index holding above these levels.
The index’s technology-heavy composition makes it particularly sensitive to continued selling in semiconductor stocks and AI infrastructure companies. Unless technology leadership improves, the Nasdaq could continue to underperform the Dow and other market indexes.
It is important to remember that the Nasdaq Composite is an index, not an individual stock. Its technical position provides information about the broader group of listed companies it tracks rather than the outlook for any single security.
Dow Jones Industrial Average: Relative Strength Returns
The Dow advanced 1.02% on Tuesday and remains above its 25-day and 200-day moving averages. It is trading just above its 50-day moving average.
This is a more constructive technical picture than the Nasdaq’s current configuration. Tuesday’s gain also ended the Dow’s two-session losing streak.
However, the index’s proximity to its 50-day moving average means that level remains important to monitor. Continued strength would help confirm that Tuesday’s advance is more than a temporary rebound.
Russell 2000: Strong Daily Rebound, but the Technical Picture Remains Weak
The Russell 2000 rose 1.65% on Tuesday, leading the major indexes after being among the weaker performers in the previous session.
Despite this strong daily advance, the index remains below its 25-day, 50-day, and 200-day moving averages. This is a technically weak configuration, indicating that the recent rebound has not yet reversed the broader downward pressure reflected in these trend indicators.
Small-cap stocks can be particularly sensitive to borrowing costs, economic growth expectations, and changes in investor risk appetite. Tuesday’s rally is encouraging, but traders should look for sustained follow-through and a recovery above key moving averages before concluding that the small-cap segment has established a durable recovery.
Key Takeaways for Traders and Investors
1. The market is showing a clear divergence in leadership.
The Dow and Russell 2000 advanced strongly, while the Nasdaq edged lower. This divergence suggests that the market’s performance is uneven, making it important to monitor individual sectors and indexes rather than relying exclusively on the S&P 500.
2. Technology remains a key risk factor.
Continued weakness in semiconductor and AI infrastructure stocks could weigh on both the Nasdaq and the S&P 500. A stabilization in these groups would provide a more convincing signal that the recent pressure on technology shares is easing.
3. The Dow currently has the more constructive technical profile.
The Dow remains above its 25-day and 200-day moving averages and just above its 50-day moving average. Its relative strength is encouraging, although further gains and sustained support would provide better confirmation.
4. The S&P 500 is approaching an important technical test.
The index is below its 25-day moving average and just above its 50-day moving average. Traders should watch whether the 50-day average continues to hold as support. A sustained break below it would raise concerns about a deeper pullback.
5. Do not confuse the Russell 2000’s rally with a confirmed trend reversal.
The Russell 2000’s 1.65% advance was impressive, but the index remains below all three moving averages. Traders should look for follow-through buying and improving technical conditions before treating the rebound as a sustained recovery.
6. Maintain disciplined risk management.
With the indexes sending mixed signals, traders should be selective about new positions and avoid assuming that a strong session guarantees continued gains. Investors may wish to focus on portfolio diversification, appropriate position sizing, and their intended investment time horizon.
Overall Assessment
Tuesday’s session brought some relief to the U.S. stock market, led by a strong rebound in the Dow and Russell 2000. Declining oil prices provided support, and semiconductor selling moderated compared with Monday. Nevertheless, technology-related weakness continued to weigh on the Nasdaq, while the S&P 500 remained below its 25-day moving average.
The technical picture remains mixed. The Dow appears relatively stronger, the S&P 500 is at an important support test, the Nasdaq faces continued underperformance risk, and the Russell 2000’s strong daily rebound has yet to overcome its broader technical weakness.
For traders, the immediate priority is to watch whether Tuesday’s gains continue and whether technology stocks stabilize. For longer-term investors, the indexes’ positions relative to their 50-day and 200-day moving averages provide useful context, but they should be considered alongside fundamentals, valuations, and broader economic conditions.
Tuesday’s U.S. Market Statistics: Breadth Improves, but Market Internals Remain Weak
New York Stock Exchange (NYSE): Strong Market Breadth, with Signs of Improvement
Market breadth on the New York Stock Exchange (NYSE) was strongly positive on Tuesday, with advancing issues comfortably outnumbering declining issues. The exchange recorded 3,024 advancers and 1,480 decliners, producing an advancer-to-decliner ratio of 2.04 to 1. In other words, approximately two stocks advanced for every stock that declined. Another 496 issues were unchanged.
This positive breadth reading indicates that Tuesday’s advance involved broad participation among NYSE-listed stocks rather than being driven solely by a small group of large-cap companies.
The exchange recorded 114 new 52-week highs and 236 new 52-week lows, compared with 83 new highs and 265 new lows in the previous session. The number of new highs increased by approximately 37%, while the number of new lows declined by about 11%.
Consequently, the ratio of new 52-week highs to new 52-week lows improved from approximately 31% in the previous session to 48% on Tuesday. This is an encouraging development, although new lows continued to outnumber new highs by more than two to one.
On Friday, new 52-week highs represented approximately 45.2% of new 52-week lows. Tuesday’s reading of 48% indicates a further improvement relative to that benchmark. The increase in new highs, combined with the decline in new lows, suggests that some of the recent selling pressure may be easing.
In recent sessions, the number of new 52-week highs has lagged significantly behind the number of new lows, at times representing less than 10% of new lows. Tuesday’s figures therefore represent a meaningful improvement from those particularly weak readings.
Nevertheless, the NYSE’s internal indicators remain weak. For market internals to strengthen more convincingly, new highs will need to increase further while new lows decline consistently. The recent improvement is encouraging, but it is too early to conclude that the market has returned to a broadly healthy condition.
NYSE trading volume reached 5.11 billion shares, approximately 8.4% lower than the previous session’s 5.58 billion shares. Although trading activity declined, the strongly positive breadth indicates that advancing stocks substantially outnumbered declining stocks.
NYSE outlook: The improvement in market breadth and the new-high/new-low relationship provides grounds for cautious optimism. Traders should monitor whether this positive two-session trend continues. Sustained improvement could help market internals recover toward the healthier levels observed a couple of months ago.
Nasdaq: Positive Daily Breadth, but Underlying Market Weakness Persists
The Nasdaq also recorded positive market breadth on Tuesday, with advancing issues outnumbering declining issues. The exchange reported 3,245 advancers and 1,608 decliners, producing an advancer-to-decliner ratio of approximately 2.02 to 1. Another 416 issues were unchanged.
This indicates that approximately two stocks advanced for every stock that declined, representing a positive daily breadth reading. The improvement is encouraging, particularly given the Nasdaq’s recent technical weakness.
However, the new-high/new-low statistics continue to paint a less favourable picture of the market’s underlying condition.
The exchange recorded 60 new 52-week highs and 354 new 52-week lows, compared with 41 new highs and 462 new lows in the previous session. The number of new highs increased by approximately 46%, while new lows declined by about 23%.
These changes represent some improvement in the Nasdaq’s internal indicators. Nevertheless, new 52-week lows continued to outnumber new highs by almost six to one, indicating that considerable weakness persists beneath the surface.
The contrast between positive daily breadth and the predominance of new 52-week lows is important. More stocks advanced than declined on Tuesday, but a substantial number of Nasdaq-listed stocks remain near the lower end of their annual trading ranges. A single session of positive breadth does not necessarily mean that the broader market has established a sustainable recovery.
The fact that new 52-week lows continued to predominate over the past two sessions reinforces the need for caution. A more convincing improvement would require a sustained decline in new lows, continued growth in new highs, and consistently positive market breadth.
Nasdaq trading volume amounted to 8.13 billion shares, approximately 17.1% lower than the previous session’s 9.81 billion shares. The Nasdaq Composite declined slightly as trading volume contracted substantially.
The combination of a modest index decline and lower volume may suggest that selling activity moderated compared with the previous session. It could also reflect reduced market participation or shifts in trading activity among sectors. However, lower volume alone does not confirm that selling pressure has run its course or that investors are primarily taking profits and rotating between sectors.
Nasdaq outlook: Positive daily breadth and the improvement in new-high/new-low figures are encouraging. However, the continued predominance of new 52-week lows suggests that the Nasdaq’s underlying market condition remains fragile. Traders should look for sustained improvement in market internals and price action before concluding that a durable recovery is underway.
Key Takeaways for Traders and Investors
1. Market breadth was positive on both exchanges.
Advancing issues substantially outnumbered declining issues on both the NYSE and Nasdaq. This indicates broad positive participation during Tuesday’s session. However, one day of positive breadth does not establish that a lasting market recovery is underway.
2. The new-high/new-low relationship remains a critical warning indicator.
On both exchanges, new 52-week lows continued to outnumber new highs. The imbalance was particularly pronounced on the Nasdaq, where there were 354 new lows compared with just 60 new highs. Continued improvement in this relationship would provide stronger evidence of a healthier market.
3. The NYSE is showing encouraging signs of recovery.
The increase in new highs, decline in new lows, and strong advancer-to-decliner ratio suggest that market internals may be gradually strengthening. Traders should watch whether this trend continues over the next several sessions.
4. The Nasdaq’s improvement needs confirmation.
Positive breadth is encouraging, but the substantial number of new 52-week lows suggests that many individual stocks remain under pressure. Traders should assess individual stock trends and sector performance rather than relying solely on the Nasdaq’s daily advance-decline figures.
5. Lower trading volume requires careful interpretation.
Volume declined on both exchanges, particularly on the Nasdaq. This may reflect reduced selling activity, but it could also indicate lower participation. Price action, breadth, and new-high/new-low trends should be considered together before drawing a bullish conclusion.
6. Maintain selectivity and disciplined risk management.
The improving daily breadth is encouraging, but the underlying market indicators remain weak. Traders and investors should avoid treating a single positive session as confirmation of a broader uptrend. Position sizing, diversification, and clearly defined risk limits remain important.
Overall Assessment
Tuesday’s session brought some relief to the U.S. stock market, led by a strong rebound in the Dow and Russell 2000. Declining oil prices provided support, and semiconductor selling moderated compared with Monday. Nevertheless, technology-related weakness continued to weigh on the Nasdaq, while the S&P 500 remained below its 25-day moving average.
The technical picture remains mixed. The Dow appears relatively stronger, the S&P 500 is at an important support test, the Nasdaq faces continued underperformance risk, and the Russell 2000’s strong daily rebound has yet to overcome its broader technical weakness.
For traders, the immediate priority is to watch whether Tuesday’s gains continue and whether technology stocks stabilize. For longer-term investors, the indexes’ positions relative to their 50-day and 200-day moving averages provide useful context, but they should be considered alongside fundamentals, valuations, and broader economic conditions.
Tuesday’s U.S. market statistics showed signs of improvement. Both the NYSE and Nasdaq recorded positive daily breadth, while the number of new 52-week highs increased and the number of new lows declined on both exchanges.
The NYSE’s strong advancer-to-decliner ratio and improving new-high/new-low relationship offer grounds for cautious optimism. The Nasdaq also showed some improvement, although the large excess of new 52-week lows over new highs indicates that underlying weakness remains substantial.
For traders, the priority is to determine whether Tuesday’s improvement can be sustained. Continued positive breadth, rising new highs, declining new lows, and supportive price action would provide stronger confirmation that market conditions are recovering.
For investors, the statistics suggest that caution and selectivity remain appropriate while the market’s internal indicators work toward a more balanced and sustainable condition.
The bottom line: Tuesday’s positive market breadth is encouraging, however, the recovery in market internals remains incomplete. The next few sessions will be important in determining whether the improvement develops into a more durable strengthening of the U.S. stock market. Today’s rally was encouraging, but the market has not yet delivered a uniform signal of renewed strength. Selectivity and risk management remain essential while the major indexes continue to move in different directions.
.
NOTICE TO READERS
The Canadian Vanguard Stock Market is about empowering you to build and manage your wealth by yourself. There is certainly no magic in managing finances or wealth but one needs to know what to do and commit to doing what is needed. When you are ready to start the journey to Take Charge and Put Your Destiny In Your Own Hands, start with reading The Canadian Vanguard every market day. If and when you need more related information or to advertise your business products or services in The Canadian Vanguard, Contact Us
Our readers are strongly advised to conduct their own research into individual stocks before making a purchase decision. In addition, investors are advised that past stock performance is no guarantee of future price appreciation. Any recommendation is not a guarantee of any particular stock’s future prices, and The Canadian Vanguard accepts no responsibility or liability for investors’ or readers’ purchases.
Stocks In The News/ Stocks To Watch and Market Strategy will soon be available only to Paying Subscribers. The dollar sign “$” in the Toronto Market section in the articles only stands for Canadian dollar and in the US market section “$” stands for US dollar.
(c) This article is published by The Canadian Vanguard on October 20, 2026