







U.S. Markets Retreat as Rising Oil Prices Fuel Selling, While TSX Edges Higher
The Canadian Vanguard Stock Market Report Weekend, October 16-18, 2026, Edition
.
The Toronto Market
Friday’s Toronto Market Index
The S&P/TSX Composite Index edged up 39.45 points, or 0.11%, to close at 36,176.55 on Friday.
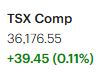
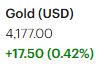
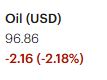
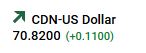
Although the TSX posted a modest gain, the broader North American stock market faced pressure. Of the four major indexes we track, the TSX was the only one to finish in positive territory. After a sharp rally on Thursday, markets retreated on Friday amid concerns over inflation and broader economic conditions, as oil prices rise.
Oil prices and bond yields continue to play an important role in shaping market sentiment. Oil prices, in particular, can be influenced by geopolitical developments beyond North America, especially tensions in the Middle East. Despite the broader market weakness, the TSX continues to demonstrate relative resilience.
Technically, following Friday’s session, the TSX Composite Index is trading below both its 25-day and 50-day moving averages. However, it remains comfortably above its 200-day moving average, suggesting that its longer-term upward trend remains intact for now.
.
Friday’s TSX Market Statistics
Market breadth on the Toronto Stock Exchange (TSX) was negative on Friday, as declining issues outnumbered advancing issues. There were 1,297 decliners and 978 advancers, resulting in a decliner-to-advancer ratio of 1.32:1, or approximately six decliners for every five advancers. Another 137 issues were unchanged.
Despite the negative market breadth, the TSX’s internal market indicators showed signs of improvement. The exchange recorded 73 new 52-week highs and 51 new 52-week lows, compared with 64 new highs and 89 new lows on Thursday.
The number of new 52-week highs increased by approximately 14% from Thursday, while the number of new lows declined by approximately 43%. Consequently, the ratio of new highs to new lows improved to approximately 1.43:1 on Friday, compared with 0.72:1 on Thursday. On Wednesday, the ratio stood at 0.60:1.
Notably, Friday marked a positive development in market internals, as new 52-week highs outnumbered new lows. This suggests that underlying market strength may be improving, even as declining issues outnumbered advancing issues during the session. However, it remains to be seen whether this improvement will persist over the coming trading sessions.
Total trading volume on the TSX reached 485,069,096 shares, broadly in line with Thursday’s volume of 482,819,628 shares. This represents a modest increase of approximately 0.47%.
Overall, although the TSX demonstrated encouraging improvement in its new-high/new-low indicators, negative market breadth remains a concern. Investors should continue to exercise caution and monitor market internals over the next several sessions to determine whether the recent improvement signals a more sustained strengthening of the market.
.
Friday’s Toronto Stock Exchange (TSX) Market Wrap-Up
Sector Performance, Market Internals, Banking Stocks and Trading Opportunities
Market Overview: The TSX Shows Relative Resilience
The S&P/TSX Composite Index edged up 39.45 points, or 0.11%, to close at 36,176.55 on Friday. Although the gain was modest compared with Thursday’s rally, the TSX demonstrated relative resilience, finishing as the only gainer among the four major North American indexes we track.
The broader North American market faced renewed selling pressure following Thursday’s strong advance. While oil prices and bond yields remain important drivers of market sentiment, oil prices can also be influenced by geopolitical developments, particularly tensions in the Middle East. These external factors continue to create uncertainty for investors.
At the sector level, six of the TSX’s ten major sectors advanced on Friday, compared with five on Thursday. This modest improvement in sector participation was encouraging, although it did not translate into broadly positive market breadth.
From a technical perspective, the TSX Composite Index finished Friday below both its 25-day and 50-day moving averages following the latest market pullback. However, it remains comfortably above its 200-day moving average, suggesting that the longer-term trend has not yet been broken.
Sector Performance: Energy Leads as Technology Slumps
Energy was Friday’s strongest sector, rising 2.73%. Durable Consumer Goods & Services, which led the market on Thursday, gained another 1.30%. Utilities advanced 1.12%, while Telecommunications rose 0.50%. Discretionary Consumer Goods & Services added 0.16%, and Financials edged up 0.06%.
On the downside, Basic Materials declined 0.20%, Industrials fell 0.30%, and Healthcare lost 0.57%. Technology was the clear laggard, tumbling 4.24%.
The sharp divergence between Energy and Technology was one of the session’s defining features. While strength in Energy helped support the TSX, the heavy Technology sell-off limited the broader market’s performance.
For traders, this divergence reinforces the importance of sector rotation. A rising index does not necessarily indicate that most stocks or sectors are performing well, and sector-specific weakness can create both risks and opportunities for stock selection.
Weekly Sector Performance
The broader weekly picture was more encouraging. Eight of the ten major sectors finished the week higher.
- Durable Consumer Goods & Services: +8.37%, the strongest sector of the week.
- Discretionary Consumer Goods & Services: +6.44%, reflecting a strong week for consumer-related stocks, including retailers.
- Basic Materials: -0.72%.
- Healthcare: -1.25%, the weakest sector of the week.
The strength in consumer-related sectors suggests that investors found opportunities beyond the market’s traditional heavyweights. Nevertheless, the sharp Friday decline in Technology highlights the potential for abrupt changes in sector leadership.
TSX Market Internals: A Mixed Picture
Friday’s market statistics presented a mixed picture. Declining issues outnumbered advancing issues, indicating that the modest index gain did not reflect uniformly positive trading across the exchange.
The TSX recorded 1,297 declining issues and 978 advancing issues, producing a decliner-to-advancer ratio of approximately 1.32:1. Another 137 issues were unchanged. Market breadth was therefore negative.
However, the new 52-week high/low data showed a notable improvement.
| Market indicator | Friday | Thursday |
|---|---|---|
| New 52-week highs | 73 | 64 |
| New 52-week lows | 51 | 89 |
| Highs-to-lows ratio | 1.43:1 | 0.72:1 |
| Trading volume | 485.1M shares | 482.8M shares |
The number of new 52-week highs increased by approximately 14% from Thursday, while new lows declined by approximately 43%. For the first time in this two-session comparison, new highs clearly outnumbered new lows.
Total trading volume was essentially unchanged, increasing by approximately 0.47% to 485.1 million shares.
What does this mean for traders?
The improvement in the new-high/new-low ratio is encouraging because it suggests that more stocks are reaching longer-term price highs relative to those making new lows. However, the negative advance-decline balance warns that selling pressure remained widespread on Friday.
These conflicting signals do not yet establish a decisive improvement in market conditions. Traders should monitor whether new highs continue to outnumber new lows and whether advancing issues begin to exceed declining issues in subsequent sessions.
Canadian Big Six Banks: Modest Gains Across Four Banks
Four of Canada’s Big Six banks finished Friday in positive territory. Their gains were modest, but the group provided some support to the Financials sector, which advanced 0.06%.
| Bank | Friday’s change | Closing price | Volume |
|---|---|---|---|
| Bank of Montreal (BMO) | +0.42% | $236.40 | 1.3M |
| Royal Bank of Canada (RY) | +0.36% | $280.01 | 4.2M |
| Bank of Nova Scotia (BNS) | +0.23% | $129.52 | 4.5M |
| Toronto-Dominion Bank (TD) | +0.14% | $170.26 | 7.5M |
Among the four advancing banks, BMO posted the strongest percentage gain, while TD recorded the highest trading volume.
Manulife Financial Corp. (MFC) was another financial stock worth noting. Manulife gained 0.82% to close at $62.67, with 4.3 million shares traded.
For traders, the modest gains across the banks suggest relative stability rather than a powerful sector-wide breakout. Investors looking for opportunities in Canadian financials should continue to assess price trends, volume, and the broader direction of interest rates before drawing conclusions about the group’s next move.
Stock to Watch: Dollarama Inc. (DOL)
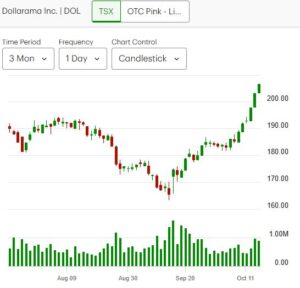
Dollarama Inc. gained 1.68% on Friday, closing at $206.56 and reaching an intraday high of $206.80. Beyond the daily gain, its recent price action makes it a stock worth monitoring.
Dollarama has advanced in five of the past six sessions and has been trending higher since the middle of September, according to the price history in this report.
The stock’s recent price levels are particularly noteworthy. Dollarama last traded above $209 on December 10, 2025, when it reached an intraday high of $209.96 before closing at $197.49. It subsequently last closed above $206 on January 2. Friday’s close of $206.56 puts the stock back near that area.
For traders, the key question is whether Dollarama can sustain its upward momentum and approach its previous highs.
Potential trading considerations:
- Momentum: Five advancing sessions out of six suggest that buyers have recently maintained control.
- Resistance: The $209–$210 area is a level to watch because of the stock’s previous intraday high near $210.
- Entry discipline: Chasing a stock after a strong run can expose traders to a sharp pullback. Waiting for a consolidation or a pullback that holds support may offer a more controlled entry.
- Confirmation: A convincing move through resistance, supported by volume and sustained price strength, would provide stronger evidence of continued momentum than a brief intraday breakout.
Dollarama is a watchlist candidate rather than an automatic buy. Traders should establish their entry criteria, risk limits, and exit plans before committing capital.
The three-month daily chart accompanying this report can help traders assess recent momentum, potential resistance, and possible entry levels.
Stock to Watch: Shopify Inc. (SHOP)
Shopify Inc. fell 5.08% on Friday, closing at $239.71 on trading volume of 1.9 million shares. The decline was substantial, making the stock worth monitoring, although its next move remains uncertain.
Shopify is a commerce technology platform that provides merchants with tools to operate and grow their businesses. While the company can incorporate artificial intelligence into its products and services, its business model differs from that of companies primarily supplying AI infrastructure, such as specialized semiconductor or data-centre technology vendors.
This distinction matters when evaluating sector exposure. Shopify’s share price may respond differently from that of AI infrastructure companies, depending on the source of market pressure. However, Shopify is not insulated from broader technology-sector weakness, changing expectations for AI-related growth, valuation pressures, or shifts in investor sentiment.
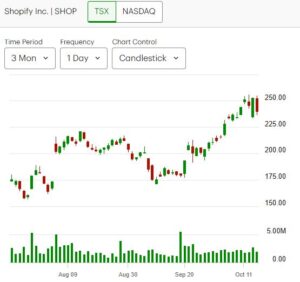
Friday’s decline could attract the attention of traders looking for a potential rebound or a longer-term entry opportunity. However, a sharp decline alone does not establish that the stock has reached a bottom.
What traders and investors should monitor:
- Price stabilization: Look for evidence that selling pressure is easing rather than assuming the decline has created a buying opportunity.
- Volume and momentum: Assess whether any recovery is supported by sustained buying interest.
- Technical levels: Identify nearby support and resistance using the daily chart before establishing a trade.
- Fundamentals and valuation: Consider the company’s growth prospects, profitability, competitive position, and valuation alongside its technical setup.
RBC Capital has maintained an Outperform rating on Shopify, according to the information supplied for this report. That rating represents an analyst view, not a guarantee of future performance, and its date and current status should be verified before publication.
For now, Shopify is a stock to keep on the watchlist. A more constructive entry setup would require evidence of stabilization or a confirmed recovery in price action.
Key Takeaways for Traders and Investors
1. The TSX is showing relative resilience, but caution remains warranted.
The index gained 0.11% on Friday while the other three major North American indexes we track declined. However, the TSX remains below its 25-day and 50-day moving averages. Its position above the 200-day moving average is a more encouraging sign for the longer-term trend.
2. Market internals are improving in one important area, but the evidence is mixed.
New 52-week highs exceeded new lows, a positive development. Nevertheless, declining stocks outnumbered advancing stocks. Traders should look for sustained improvement in both measures before interpreting Friday’s data as a broad-based recovery.
3. Sector rotation creates opportunities, but selectivity is essential.
Energy led Friday’s market, while Technology suffered a steep decline. The weekly strength in consumer-related sectors also suggests that opportunities may differ significantly from one industry to another. Traders should focus on individual price action rather than relying solely on the direction of the index.
4. Dollarama offers a momentum setup to monitor.
The stock’s recent strength makes it worth watching for a potential continuation toward the $209–$210 area. However, traders should avoid chasing extended price moves and instead look for a disciplined entry with clearly defined risk.
5. Shopify’s decline warrants attention, not an automatic purchase.
The stock may appeal to traders watching for stabilization or a rebound, but further downside remains possible. A confirmed change in price action and a review of the company’s fundamentals would strengthen the case for considering an entry.
6. Maintain risk discipline.
With negative market breadth, a sharp Technology sell-off, and mixed market internals, traders should remain selective. Position sizing, stop-loss planning, and confirmation of technical setups are particularly important when market conditions are unsettled.
Final Outlook
Friday’s session delivered a small gain for the TSX, but the underlying picture was more complicated. Energy strength and improving new-high/new-low statistics offered encouraging signals, while negative market breadth and weakness in Technology argued for continued caution.
The next few trading sessions will be important in determining whether the improvement in market internals develops into broader participation or proves temporary.
For active traders, Dollarama and Shopify offer different setups to monitor: Dollarama for potential momentum continuation and Shopify for possible stabilization following a sharp decline. Neither setup should be treated as a trading signal without confirmation from price action, volume, and risk-reward analysis.
For investors, the TSX’s position above its 200-day moving average remains a constructive longer-term observation, but a sustained recovery in shorter-term momentum and market breadth would provide greater confidence in the market’s near-term direction.
.
The US Markets
Friday’s U.S. Market Indexes
Technology Sell-Off Deepens as Nasdaq and Russell 2000 Underperform
Market Overview: Broad-Based Selling Hits U.S. Stocks
All four major U.S. stock market indexes we track finished lower on Friday, with technology-heavy indexes suffering the steepest losses.
The Dow Jones Industrial Average fell 175.28 points, or 0.34%, to close at 52,002.41. The S&P 500 dropped 84.62 points, or 1.09%, to finish at 7,659.44. The Nasdaq Composite plunged 572.99 points, or 2.14%, to close at 26,140.03, while the Russell 2000 declined 45.90 points, or 1.66%, to end the session at 2,721.37.

The Nasdaq was the worst performer of the four indexes, followed by the Russell 2000. Friday’s session highlighted the continuing pressure on technology stocks, particularly semiconductor manufacturers and companies associated with AI infrastructure.
The recent weakness in technology suggests that investors may be rotating away from some of the sector’s high-growth stocks amid changing market sentiment. Semiconductor-related companies have experienced particularly heavy selling, weighing on the Nasdaq and contributing to the broader market’s decline.
However, traders should remember that technology stocks can be highly volatile in both directions. The same stocks that experience sharp losses during market sell-offs can also lead powerful rallies when bullish sentiment returns. The challenge is distinguishing a temporary pullback from a more sustained deterioration in momentum.
Index Performance: Nasdaq and Russell 2000 Face Greater Technical Pressure
The latest price action has weakened the technical outlook for several major U.S. indexes. Based on the moving-average readings provided, the Nasdaq and S&P 500 have fallen below their respective 25-day and 50-day moving averages, although both remain above their 200-day moving averages.
Nasdaq Composite: High Volatility and Elevated Risk
The Nasdaq Composite fell 2.14% on Friday, making it the session’s weakest major index. Its exposure to technology companies, including semiconductor manufacturers and businesses linked to AI infrastructure, leaves it vulnerable when selling pressure concentrates in these areas.
The index is now trading below its 25-day and 50-day moving averages. Although it remains above its 200-day moving average, the deterioration in its shorter-term technical position warrants caution.
For active traders, the Nasdaq is a market-risk indicator worth watching closely. Further weakness could signal continued pressure on technology and growth stocks, while a recovery above the shorter-term moving averages would provide an initial sign of improving momentum.
S&P 500: Broad-Market Weakness Raises Concerns
The S&P 500 declined 1.09% on Friday. Although its loss was smaller than the Nasdaq’s, the index remains vulnerable to further declines if weakness in large technology stocks persists.
The S&P 500 includes many influential technology companies, so concentrated selling in this sector can weigh heavily on the broader index. Its position below the 25-day and 50-day moving averages suggests that near-term momentum has weakened.
However, the index remains above its 200-day moving average, leaving its longer-term technical picture less damaged than its short-term trend. Traders should watch whether the S&P 500 can stabilize and reclaim its shorter-term moving averages or whether selling pressure begins to threaten the longer-term trend.
Dow Jones Industrial Average: Relative Resilience
The Dow Jones Industrial Average declined 0.34%, making it the strongest performer among the four indexes on Friday.
Unlike the Nasdaq and S&P 500, the Dow remains above its 25-day and 200-day moving averages. However, it is trading close to its 50-day moving average, making that level an important area to monitor.
The Dow’s relative outperformance suggests that the selling pressure was more concentrated in technology and growth-oriented stocks than across all segments of the market equally. Nevertheless, its proximity to the 50-day moving average means traders should watch for either support and stabilization or a further technical breakdown.
Russell 2000: Small-Cap Stocks Under Pressure
The Russell 2000 fell 1.66% on Friday, making it the second-worst performer among the four indexes.
More concerning is its technical position. Based on the readings provided, the Russell 2000 is now below its 25-day, 50-day, and 200-day moving averages.
Trading below all three moving averages points to significant technical weakness across the small-cap index. Small-cap stocks can be particularly sensitive to financing costs, interest-rate expectations, and changes in risk appetite. When investors become more defensive, these stocks may face additional selling pressure.
For traders, the Russell 2000 currently presents a high-risk technical environment. A sustained recovery above the moving averages would be needed to improve the chart, while further declines could reinforce the bearish trend. Traders considering small-cap positions should be especially disciplined about position sizing and downside risk.
Key Takeaways for Traders and Investors
1. Technology remains a major source of market risk.
The Nasdaq’s 2.14% decline highlights the pressure facing technology stocks, particularly semiconductor and AI infrastructure companies. Traders should monitor whether selling spreads further across the sector or begins to ease.
2. The Nasdaq is showing significant short-term weakness.
Trading below the 25-day and 50-day moving averages indicates deteriorating near-term momentum. Its position above the 200-day moving average offers some longer-term perspective, but does not rule out further declines.
3. The Russell 2000 warrants extra caution.
The small-cap index is below all three monitored moving averages. Until its price action improves, traders should be cautious about assuming that small-cap stocks are ready for a sustained recovery.
4. The Dow is showing relative strength, but the 50-day moving average matters.
The Dow’s smaller loss and position above its 25-day and 200-day moving averages are comparatively constructive. Its proximity to the 50-day moving average, however, makes the next few sessions important.
5. Avoid treating every sharp decline as a buying opportunity.
Technology stocks can rebound aggressively after sell-offs, but a lower price alone does not confirm that a bottom has formed. Traders should look for stabilization, improving momentum, and confirmation from price and volume before considering an entry.
6. Monitor whether weakness spreads or begins to stabilize.
The next few sessions may help determine whether Friday’s selling represents a short-term correction or the beginning of a more sustained deterioration. Watch the Nasdaq, S&P 500, and Russell 2000 alongside the Dow to assess whether selling pressure remains concentrated or becomes more widespread.
Final Outlook
Friday’s session reinforced the growing divergence between the major U.S. indexes. The Dow demonstrated relative resilience, while the Nasdaq and Russell 2000 experienced much heavier selling. The S&P 500 also weakened, reflecting the influence of technology stocks on the broader market.
The Nasdaq’s position below its 25-day and 50-day moving averages and the Russell 2000’s position below all three monitored moving averages are important warning signs for active traders. Although the Nasdaq and S&P 500 remain above their 200-day moving averages, their near-term momentum has weakened considerably.
For now, a selective and risk-conscious approach is warranted. Traders should avoid assuming that heavily sold technology stocks have reached a bottom and should wait for clearer evidence of stabilization before committing to aggressive bullish positions. The next several sessions will be important in determining whether the market can regain momentum or whether further downside pressure lies ahead.
Friday’s U.S. Market Statistics
NYSE and Nasdaq Market Breadth, New Highs and Lows, and Trading Volume
New York Stock Exchange (NYSE): Market Internals Remain Weak
Market breadth on the New York Stock Exchange (NYSE) was decidedly negative on Friday, as declining issues significantly outnumbered advancing issues. The exchange recorded 2,732 decliners and 1,839 advancers, producing a decliner-to-advancer ratio of 1.48:1. In practical terms, approximately three stocks declined for every two that advanced. Another 480 issues were unchanged.
The negative breadth indicates that selling pressure extended across a substantial number of NYSE-listed stocks, even though the intensity of the selling varied among individual securities.
New 52-Week Highs and Lows: Signs of Modest Improvement
The NYSE recorded 113 new 52-week highs and 250 new 52-week lows on Friday, compared with 128 new highs and 304 new lows on Thursday.
Although the number of new highs declined by approximately 12% from Thursday, new lows fell by approximately 18%. Consequently, the ratio of new 52-week highs to new 52-week lows improved modestly, from approximately 42% on Thursday to 45.2% on Friday.
The more encouraging development is the reduction in the number of stocks reaching new 52-week lows. During the recent period of market weakness, new lows have frequently overwhelmed new highs, reflecting deteriorating underlying market conditions. Friday’s figures suggest a modest improvement, although the absolute number of new lows remains elevated relative to new highs.
This is a development worth monitoring, but it is too early to conclude that market internals have entered a sustained recovery. A more convincing improvement would involve new lows continuing to decline, new highs expanding, and advancing issues beginning to outnumber decliners.
NYSE Trading Volume Declines
Total NYSE trading volume reached approximately 5.58 billion shares on Friday, down about 9.7% from Thursday’s 6.18 billion shares.
The lower volume indicates that fewer shares changed hands during Friday’s session. However, lower volume alone does not establish that selling pressure has eased or that investors are simply taking profits. It can reflect several factors, including reduced participation, changes in trading activity, or a shift in investor positioning.
NYSE assessment: Market breadth remains negative, but the reduction in new 52-week lows and the improvement in the highs-to-lows ratio offer tentative signs of stabilization. Traders should look for confirmation over the next several sessions before interpreting these developments as a meaningful recovery in market internals.
Nasdaq: Persistent Weakness in Market Internals
Market breadth on the Nasdaq was considerably weaker than on the NYSE. There were 3,676 declining issues and just 1,292 advancing issues, resulting in a decliner-to-advancer ratio of approximately 2.84:1. In other words, nearly three stocks declined for every one that advanced. Another 154 issues were unchanged.
This pronounced imbalance confirms that selling pressure remained widespread across Nasdaq-listed stocks on Friday. The figures are consistent with the weakness in the Nasdaq Composite Index, which fell 2.14% during the session.
New 52-Week Highs and Lows: The Imbalance Persists
The Nasdaq recorded 70 new 52-week highs and 448 new 52-week lows on Friday, compared with 76 new highs and 534 new lows on Thursday.
Both new highs and new lows declined from the previous session. New highs fell by approximately 8%, while new lows declined by approximately 16%.
As a result, the ratio of new 52-week highs to new 52-week lows improved from approximately 14.2% on Thursday to 15.6% on Friday. Put differently, there were roughly 16 new highs for every 100 new lows, compared with approximately 14 for every 100 on Thursday.
Although this represents a modest improvement, the overall picture remains concerning. New lows continue to substantially outnumber new highs, indicating that a large number of Nasdaq-listed stocks remain under pressure.
The persistence of this imbalance over recent weeks is particularly important for traders. It suggests that the weakness is not confined to a single session and that the market has yet to demonstrate a convincing recovery in its underlying breadth.
Nasdaq Trading Volume Falls Despite the Sharp Decline
Nasdaq trading volume reached approximately 9.81 billion shares on Friday, down about 12.4% from Thursday’s 11.19 billion shares.
The combination of a sharp decline in the Nasdaq Composite and lower trading volume deserves attention. It may indicate that Friday’s sell-off occurred with less overall share turnover than the previous session, but it does not, by itself, prove that the decline was driven mainly by profit-taking or sector rotation.
To establish whether selling pressure is easing, traders should monitor subsequent price action alongside volume, market breadth, and the performance of technology and semiconductor stocks.
Nasdaq assessment: Market internals remain weak. The slight improvement in the new-high/new-low ratio is encouraging at the margin, but the high number of new lows and the substantial excess of declining stocks indicate that downside risks remain elevated.
Key Takeaways for Traders and Investors
1. Market breadth remains a significant warning sign.
Both exchanges recorded more declining stocks than advancing stocks. The Nasdaq’s decliner-to-advancer ratio of 2.84:1 was especially weak, indicating that selling pressure was widespread.
2. The NYSE is showing tentative signs of stabilization.
New 52-week lows declined from 304 to 250, and the highs-to-lows ratio improved from approximately 42% to 45.2%. These changes are constructive, but negative breadth and the continued prevalence of new lows suggest that confirmation is still needed.
3. Nasdaq market internals remain particularly vulnerable.
Friday’s 448 new lows compared with only 70 new highs highlight the persistent weakness among Nasdaq-listed stocks. Traders should be cautious about assuming that technology and growth stocks have already bottomed.
4. Lower trading volume is not necessarily bullish.
Trading volume declined on both exchanges compared with Thursday. While this may reflect reduced participation or changing positioning, it cannot independently confirm that selling pressure is subsiding. Price action and breadth should be assessed together.
5. Monitor the next several sessions for confirmation.
A sustained decline in new lows, an increase in new highs, and an improvement in the advance-decline balance would provide stronger evidence of healthier market conditions. If these indicators deteriorate again, traders should remain alert to further downside risk.
6. Maintain disciplined risk management.
Geopolitical developments, economic data, interest-rate expectations, and changes in global investor sentiment can all influence U.S. markets. Traders should use appropriate position sizing, define exit levels in advance, and be prepared to reduce or close positions when their trading thesis is invalidated.
Final Outlook
Friday’s market statistics offer a mixed but still cautious picture. The NYSE showed a modest improvement in its new-high/new-low ratio, supported by a reduction in the number of new lows. However, declining issues continued to outnumber advancing issues on both exchanges.
The Nasdaq remains the greater concern, with nearly three decliners for every advancer and more than six new 52-week lows for every new high. These figures reinforce the technical weakness observed in the Nasdaq Composite and the continuing pressure on technology-related stocks.
For traders and investors, the key question is whether Friday’s modest improvement in certain indicators will continue. Until market breadth strengthens and new lows decline more consistently, a defensive and selective approach remains appropriate. Protecting capital and responding promptly to changing market conditions should take priority over aggressively anticipating a market rebound.
.
Friday’s U.S. Market Wrap-Up Report
Technology Stocks Under Heavy Selling Pressure as Market Risks Increase
Market Overview: A Difficult Session for U.S. Stocks
Friday was a bruising session for U.S. equities, with technology stocks bearing the brunt of the selling. The Nasdaq Composite plunged 2.14%, while the Russell 2000 fell 1.66%. The S&P 500 declined 1.09%, and even the relatively resilient Dow Jones Industrial Average finished lower, slipping 0.34%.
When an index comprising hundreds of stocks falls by more than 2% in a single session, the damage can extend well beyond the headline number. Individual stocks may experience substantially larger losses, particularly in sectors where valuations and investor expectations have been elevated.
Friday’s market action was consistent with the weakness observed in semiconductor stocks, AI infrastructure companies, and other growth-oriented businesses. Many recent market leaders came under significant selling pressure, highlighting the risks of concentrated exposure to high-momentum stocks when sentiment turns negative.
Crude oil prices also moved sharply higher amid escalating geopolitical tensions. Rising oil prices can increase concerns about inflation, particularly if higher energy costs persist and spread through the broader economy. If inflation proves more persistent, interest rates could remain elevated for longer, putting additional pressure on equity valuations, especially those of growth stocks whose valuations depend heavily on future earnings.
However, the relationship between oil prices, interest rates, and equities is complex. Higher oil prices can benefit energy producers even as they create challenges for other sectors. Friday’s sector performance illustrated this divergence.
Sector Performance: Energy Gains While Technology Slumps
Only five of the eleven sectors tracked in this report finished Friday in positive territory. Energy led the gainers, rising 1.22%, benefiting from the strength in oil prices.
Durable Consumer Goods & Services advanced 0.73%, followed by Utilities, up 0.21%. Basic Materials gained 0.11%, while Telecommunications Services edged up 0.08%.
On the downside, Financials slipped 0.13%, while Technology was the session’s weakest sector, plunging 2.72%.
The contrast between Energy and Technology was particularly notable. Higher oil prices supported energy-related shares, while technology stocks faced intense selling pressure. The weakness in Technology also weighed on the Nasdaq and contributed to the S&P 500’s decline.
For traders, this divergence reinforces the importance of monitoring sector performance rather than relying solely on the direction of the broader indexes. Even during a falling market, individual sectors may offer relative strength, although that strength does not guarantee continued gains.
Semiconductor Stocks: Former Market Leaders Under Pressure
Semiconductor stocks were among Friday’s most prominent casualties. Several companies that had attracted substantial investor enthusiasm experienced sharp declines, underscoring the risks of momentum-driven trades when market sentiment reverses.
- SanDisk Corporation (SNDK) fell 6.86% to close at $1,299.30, with 9.0 million shares traded.
- Micron Technology Inc. (MU) declined 5.63% to $878.84, with 30.5 million shares traded.
- Intel Corporation (INTC) dropped 5.79% to $89.85. The reported trading volume was 1,213 million shares and should be verified before publication.
- NVIDIA Corporation (NVDA) proved comparatively resilient, declining 1.43% to $214.13, with 121.3 million shares traded.
Although NVIDIA also finished lower, its decline was considerably smaller than those of SanDisk, Micron, and Intel.
Most of the semiconductor stocks have charts similar to Intel’s chart as shown below. The stocks have suffered severe declines in the last twelve market sessions.
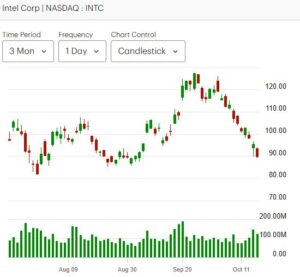
The broad weakness across semiconductor stocks is important because these companies are closely tied to investor expectations for AI-related spending, computing demand, and future earnings growth. When investors reassess those expectations, selling can spread rapidly across the industry.
For traders, the immediate question is whether these declines represent a temporary correction within an ongoing uptrend or the beginning of a more sustained deterioration. A sharp fall alone does not answer that question. Price stabilization, subsequent trading volume, sector performance, and the ability of individual stocks to reclaim important technical levels will be important signals to monitor.
More Recent High-Fliers Take Heavy Losses
Friday’s selling was not confined to semiconductor manufacturers. Several other stocks that have attracted investor attention also recorded substantial declines.
- Moderna Inc. (MRNA) fell 7.82% to close at $218.01, with 21.4 million shares traded.
- Everpure Inc. (P) declined 7.06% to $123.98, with 3.9 million shares traded.
- Palantir Technologies Inc. (PLTR) slumped 7.22% to $186.03, with 33.4 million shares changing hands.
These declines demonstrate how quickly market sentiment can change when investors become more defensive. Stocks with elevated expectations or strong preceding rallies can be particularly vulnerable when traders take profits or reassess their willingness to pay premium valuations.
However, the reasons for a decline can differ from company to company. Investors should distinguish broad market selling from stock-specific developments, earnings concerns, valuation changes, or company news before deciding whether a decline presents an opportunity.
Cybersecurity Stocks Also Come Under Pressure
Cybersecurity shares were another area of weakness on Friday.
- CrowdStrike Holdings Inc. (CRWD) fell 7%.
- Fortinet Inc. (FTNT) declined 7.03%.
- SentinelOne Inc. (S) dropped 7.64% to close at $21.58, with 17.7 million shares traded.
The weakness across these companies suggests that selling pressure extended beyond semiconductors and AI infrastructure into other technology-related industries.
For traders, the simultaneous declines are worth monitoring because they may indicate a broader reduction in exposure to technology and growth stocks rather than an isolated reaction to one company.
That does not necessarily mean the underlying businesses have deteriorated by the same magnitude as their share prices. Nevertheless, traders should avoid assuming that a sharp sell-off automatically makes a stock attractive. A more convincing setup would involve stabilization, improving relative strength, or a confirmed recovery in price action.
Not Everything Fell: Selected Stocks Show Relative Strength
Despite the broad market weakness, several stocks finished Friday in positive territory.
Financials: Visa Inc. (V)
Visa gained 0.73% to close at $402.65, with 6.8 million shares traded. Its positive performance contrasted with the weakness in many technology stocks and the modest decline in the Financials sector.
Energy: EOG Resources Inc. (EOG)
EOG Resources rose 4.25%, with 5.3 million shares traded. The gain was consistent with the relative strength in Energy amid higher crude oil prices.
Media and Information Services: Thomson Reuters Corp. (TRI)
Thomson Reuters advanced 1.04%, with 3.1 million shares changing hands.
These gainers illustrate why selective stock analysis remains important even during difficult market sessions. Relative strength can help traders identify stocks that are outperforming the broader market.
However, a single positive session does not establish a durable uptrend. Traders should look for follow-through in subsequent sessions and assess whether the stocks maintain their relative strength if market volatility persists.
Market Internals: Warning Signs Beneath the Indexes
The broader market statistics reinforce the cautious message from Friday’s index performance.
On the NYSE, declining issues outnumbered advancing issues by approximately 1.48 to 1. On the Nasdaq, the imbalance was more severe, with approximately 2.84 decliners for every advancer.
The new 52-week high/low data presented a mixed picture. On the NYSE, 113 stocks reached new 52-week highs, compared with 250 new lows. Although new lows declined from Thursday’s 304, they continued to outnumber new highs substantially.
The Nasdaq recorded 70 new 52-week highs and 448 new lows. The number of new lows declined from Thursday’s 534, but the imbalance remains concerning.
Trading volume also declined from Thursday on both exchanges: approximately 9.7% lower on the NYSE and 12.4% lower on the Nasdaq.
The reduction in new lows is a tentative positive development, but the persistently negative advance-decline balances and large number of Nasdaq new lows indicate that the market’s underlying health remains weak.
Lower trading volume does not, by itself, confirm that selling pressure has eased. Traders should watch whether declining issues become less dominant, new lows continue to contract, and more stocks begin to participate in any market recovery.
Key Takeaways for Traders and Investors
1. Protect capital when market conditions deteriorate.
Friday’s sharp losses in the Nasdaq, semiconductor stocks, and cybersecurity companies demonstrate how quickly individual positions can move against traders. Review position sizes, concentration in correlated technology stocks, and predefined exit levels.
2. Be selective about buying the dip.
Some stocks may become more attractive after a correction, but price declines alone are not reliable buy signals. Look for evidence of stabilization, improving relative strength, and a favorable risk-reward setup before entering a trade.
3. Monitor semiconductors as a barometer of technology sentiment.
The performance of NVIDIA, Micron, SanDisk, and Intel may help traders assess whether pressure on technology stocks is easing or spreading. A sustained recovery across several semiconductor stocks would be more constructive than a rebound in a single name.
4. Watch market breadth, not just the indexes.
The Nasdaq’s decliner-to-advancer ratio of 2.84:1 and its 448 new 52-week lows show that weakness is widespread. A healthier recovery would ideally involve improving breadth and fewer stocks making new lows.
5. Recognize sector rotation without assuming it will persist.
Energy benefited from rising oil prices, while Technology weakened. Relative strength in EOG Resources and Visa also stood out. These differences can help traders build watchlists, but confirmation over subsequent sessions remains important.
6. Consider reducing excessive exposure if volatility remains elevated.
Investors and traders who are heavily concentrated in high-volatility stocks may wish to reassess their exposure. Holding more cash can preserve flexibility and provide the ability to respond to opportunities, but any reduction should reflect individual risk tolerance, investment objectives, and time horizon rather than an assumption that the market must fall further.
7. Keep geopolitical and economic risks in perspective.
Events outside North America can influence oil prices, inflation expectations, interest rates, and investor sentiment. Because these developments are difficult to predict, risk management and a disciplined trading process are generally more dependable than attempting to forecast every headline.
Final Outlook: Caution Now, Opportunity When Conditions Improve
Friday’s session was a reminder that even strong market leaders can suffer substantial losses when sentiment turns negative. The Nasdaq and Russell 2000 experienced particularly sharp declines, semiconductor stocks came under heavy selling pressure, and weakness extended into cybersecurity and other growth-oriented names.
The market statistics provide little basis for declaring an immediate recovery. Although the number of new 52-week lows declined on both the NYSE and Nasdaq, negative market breadth and the continued excess of new lows over new highs suggest that underlying conditions remain fragile.
For active traders, the priority should be to protect capital, avoid chasing volatile stocks, and wait for clearer evidence before taking aggressive positions. For longer-term investors, corrections can create opportunities to acquire quality businesses at more attractive valuations, but careful attention to fundamentals, valuation, and portfolio risk remains essential.
Markets move through advances, corrections, and recoveries. No phase lasts forever, but the timing of a recovery is uncertain. Maintaining flexibility during volatile periods can help investors participate when stronger opportunities emerge without taking unnecessary risks in the meantime.
.
NOTICE TO READERS
The Canadian Vanguard Stock Market is about empowering you to build and manage your wealth by yourself. There is certainly no magic in managing finances or wealth but one needs to know what to do and commit to doing what is needed. When you are ready to start the journey to Take Charge and Put Your Destiny In Your Own Hands, start with reading The Canadian Vanguard every market day. If and when you need more related information or to advertise your business products or services in The Canadian Vanguard, Contact Us
Our readers are strongly advised to conduct their own research into individual stocks before making a purchase decision. In addition, investors are advised that past stock performance is no guarantee of future price appreciation. Any recommendation is not a guarantee of any particular stock’s future prices, and The Canadian Vanguard accepts no responsibility or liability for investors’ or readers’ purchases.
Stocks In The News/ Stocks To Watch and Market Strategy will soon be available only to Paying Subscribers. The dollar sign “$” in the Toronto Market section in the articles only stands for Canadian dollar and in the US market section “$” stands for US dollar.
(c) This article is published by The Canadian Vanguard on October 17, 2026