




U.S. Markets Advance, Led by the Dow and Russell 2000, as Technology Stocks Weigh on Nasdaq
The Canadian Vanguard Stock Market Report – Thursday October 15, 2026 Edition
.
The Toronto Market
Thursday’s Toronto Market Index
The S&P/TSX Composite Index rallied 552.64 points, or 1.55%, to close at 36,137.10 on Thursday.
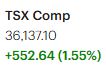


The TSX rebounded strongly from Wednesday’s steep sell-off, regaining the psychologically important 36,000 level in a broadly positive trading session. However, geopolitical tensions in the Middle East remain elevated, continuing to disrupt oil shipments and fuel volatility in oil prices. Despite these ongoing concerns, oil prices declined on Thursday, offering some relief to markets.
From a technical perspective, the TSX Composite Index remains below both its 25-day and 50-day moving averages, suggesting that short-term market momentum remains under pressure despite Thursday’s recovery. However, the index continues to trade comfortably above its 200-day moving average, indicating that its longer-term upward trend remains intact.
Thursday’s TSX Market Statistics
Market breadth on the Toronto Stock Exchange (TSX) turned decisively positive on Thursday, with advancing issues significantly outnumbering declining issues. There were 1,534 advancers and 709 decliners, resulting in an advancer-to-decliner ratio of 2.16:1, or approximately two advancers for every decliner. Another 124 issues remained unchanged. This marked a strong reversal from Wednesday’s bearish session and indicated a broad-based recovery across the market.
Despite the improvement in daily market breadth, the exchange’s longer-term internal indicators remain weakened. The TSX recorded 64 new 52-week highs and 89 new 52-week lows, compared with 61 new highs and 102 new lows in the previous session. The number of new highs increased by approximately 5%, while new lows declined by about 13%.
The ratio of new 52-week highs to new lows improved to approximately 18:25, compared with roughly 3:5 on Wednesday. Although this represents a modest improvement in market internals, new lows continued to outnumber new highs, suggesting that underlying market weakness has not yet fully subsided. Further improvement over the coming sessions would help confirm whether the market is beginning to establish a more sustainable recovery.
Total trading volume on the TSX reached 485,069,096 shares, virtually unchanged from Wednesday’s 482,819,628 shares. The relatively stable volume, combined with the positive market breadth, suggests that Thursday’s rebound was accompanied by broad participation among listed stocks.
Market Outlook: Despite Thursday’s encouraging recovery, investors should continue to exercise caution. The market has been alternating between gains and declines, reflecting persistent uncertainty and fragile short-term sentiment. While the improvement in market breadth and the decline in new 52-week lows are positive developments, further confirmation is needed before concluding that market conditions have stabilized. Investors should monitor upcoming trading sessions for sustained gains, improving market internals, and a continued reduction in new lows. A consistent pattern of positive sessions would provide stronger evidence that the TSX is regaining momentum.
.
Thursday’s Toronto Stock Market (TSX) Wrap-Up Report
A Strong Rebound, but Market Internals Remain Fragile
1. Market Overview
The Toronto Stock Exchange staged a strong rebound on Thursday, recovering from Wednesday’s sharp sell-off. The S&P/TSX Composite Index rallied 552.64 points, or 1.55%, to close at 36,137.10, reclaiming the psychologically important 36,000 level.
Market breadth improved significantly, with advancing issues comfortably outnumbering declining issues. However, the recovery was uneven across sectors, and several major industry groups remained under pressure.
Of the ten major sectors, five advanced while the other five declined. Consumer Durables & Services led the gainers, rising 2.05%. Utilities gained 0.94%, Telecommunications advanced 0.91%, Consumer Discretionary rose 0.57%, and Energy edged up 0.15%.
On the downside, Financials fell 0.46%, Healthcare declined 0.76%, Industrials lost 1.13%, Technology dropped 1.35%, and Basic Materials slumped 4.33%, making it the weakest sector of the session.
The divergence between sectors suggests that Thursday’s rebound was not a uniform recovery across the market. Strength in consumer-related stocks and financial shares contrasted with significant weakness in Basic Materials and Technology.
Geopolitical tensions in the Middle East continue to pose risks to oil shipments and energy prices. Despite these concerns, oil prices declined on Thursday, while the Energy sector posted a modest gain.
From a technical perspective, the TSX Composite Index remains below its 25-day and 50-day moving averages, indicating that short-term momentum remains under pressure. However, the index continues to trade comfortably above its 200-day moving average, suggesting that its longer-term trend has not yet been decisively broken.
2. TSX Market Breadth and Internal Indicators
Thursday’s market statistics showed a substantial improvement in daily market breadth.
- Advancing issues: 1,534
- Declining issues: 709
- Unchanged issues: 124
- Advancer-to-decliner ratio: 2.16:1
- New 52-week highs: 64
- New 52-week lows: 89
- Total trading volume: 485.1 million shares
The 2.16:1 advancer-to-decliner ratio indicates broad participation in Thursday’s rebound and represents a marked reversal from Wednesday’s bearish session.
The new-high and new-low statistics, however, paint a more cautious picture. The number of new 52-week highs increased from 61 to 64, an improvement of approximately 5%, while new 52-week lows declined from 102 to 89, a reduction of approximately 13%.
Consequently, the ratio of new highs to new lows improved from approximately 3:5 on Wednesday to 18:25 on Thursday. Nevertheless, new lows continued to outnumber new highs, suggesting that underlying market conditions remain weakened.
Total trading volume reached 485.1 million shares, virtually unchanged from Wednesday’s 482.8 million shares. The combination of stronger market breadth and broadly stable volume is encouraging, although one positive session is insufficient to confirm a durable recovery.
Market interpretation: Daily buying participation improved substantially, but longer-term market internals have yet to confirm a sustained turnaround. Traders should watch for continued improvement in the advance-decline balance, fewer new 52-week lows, and stronger participation across sectors.
3. Canadian Big Six Banks: Broad-Based Strength
All six of Canada’s major banks advanced on Thursday, providing a positive counterpoint to the weakness in several other sectors.
| Bank | Ticker | Closing Price | Daily Change | Volume |
|---|---|---|---|---|
| Toronto-Dominion Bank | TD | $167.83 | +2.22% | 11.5M |
| National Bank of Canada | NA | $202.31 | +2.15% | 1.8M |
| Bank of Nova Scotia | BNS | $128.34 | +1.83% | 3.5M |
| Canadian Imperial Bank of Commerce | CM | $158.44 | +1.81% | 2.5M |
| Bank of Montreal | BMO | $235.18 | +1.33% | 2.57M |
| Royal Bank of Canada | RY | $277.25 | +1.27% | 4.8M |
Toronto-Dominion Bank led the group, gaining 2.22% to close at $167.83 on 11.5 million shares traded. National Bank followed with a 2.15% advance.
The fact that all six banks finished higher is an encouraging sign for the Canadian financial sector. However, Financials as a whole declined 0.46%, illustrating that strength in the major banks did not translate into gains across the entire sector.
Trading perspective: Traders may wish to monitor whether the banks can sustain Thursday’s gains in subsequent sessions. Follow-through buying, supported by healthy trading volume and improving price action, would provide stronger evidence of renewed momentum. A single rebound, however, should not be treated as confirmation of a new uptrend.
4. Mining and Precious Metals Stocks
Selected precious-metals stocks continued to demonstrate relative strength, particularly Agnico Eagle Mines.
- Agnico Eagle Mines (AEM): Advanced 5.69% to close at $266.18, with approximately 605,000 shares traded.
- Wheaton Precious Metals (WPM): Gained 2.49% to close at $188.88, with approximately 669,000 shares traded.
- Franco-Nevada (FNV): Rose 2.22% to close at $341.80, with approximately 259,000 shares traded.
Agnico Eagle was the strongest performer among these three companies, posting a substantial gain. Wheaton Precious Metals and Franco-Nevada also finished higher, outperforming the broader market’s 1.55% advance.
Franco-Nevada’s trading volume of approximately 259,000 shares was below its reported 50-day average daily volume of roughly 350,000 shares. This means that its price advance occurred on below-average volume, making subsequent trading activity worth monitoring for confirmation.
The broader Basic Materials sector, however, declined 4.33%, making it the weakest major sector of the day. The strength in these selected precious-metals stocks therefore highlights the importance of distinguishing individual stock performance from the performance of the sector as a whole.
Trading perspective: Traders should continue to evaluate individual mining and precious-metals stocks on their own merits. Relative strength can help identify potential opportunities, but entry decisions should also consider price structure, trading volume, commodity-price movements, and predefined risk limits.
5. Sector Rotation and Emerging Opportunities
The divergence among sectors reinforces the importance of monitoring sector rotation rather than assuming that a rising index lifts all stocks.
Consumer Durables & Services led Thursday’s sector performance, while the major banks delivered broad-based gains. Selected precious-metals stocks also performed well despite the sharp decline in Basic Materials.
Healthcare may warrant further observation if it begins attracting sustained buying interest. However, the sector declined 0.76% on Thursday, so the supplied session data do not establish that Healthcare outperformed the broader market or that capital is definitively rotating into it.
For traders and investors considering a shift away from previously high-performing sectors, the priority should be to identify where relative strength is actually emerging. This requires monitoring sector returns over multiple sessions, comparing them with the TSX Composite Index, and examining whether improving performance is supported by volume and stronger market breadth.
Rather than abandoning a previously strong sector after a single weak session, investors may benefit from looking for evidence of a sustained deterioration in relative strength and a corresponding improvement elsewhere.
6. Key Takeaways for Traders and Investors
1. Thursday’s rebound is encouraging, but confirmation is still needed.
The TSX gained 1.55% and recovered above 36,000. Nevertheless, the index remains below its 25-day and 50-day moving averages. Traders should look for follow-through gains and improving technical conditions before concluding that short-term momentum has turned decisively bullish.
2. Market breadth improved, but underlying internals remain weak.
The 2.16:1 advancer-to-decliner ratio is a positive development. However, new 52-week lows still exceeded new highs, indicating that market weakness has not fully dissipated. Continued improvement in these indicators would strengthen the case for a broader recovery.
3. Watch the major banks for follow-through strength.
All six Canadian big banks advanced on Thursday, with TD and National Bank leading the group. Sustained gains and supportive volume could help confirm that the banking sector is regaining momentum.
4. Focus on individual stock strength rather than sector labels alone.
Agnico Eagle, Wheaton Precious Metals, and Franco-Nevada all advanced, even as Basic Materials suffered a sharp decline. This divergence demonstrates why traders should evaluate individual stocks alongside their sector benchmarks.
5. Monitor sector rotation, but avoid premature conclusions.
Healthcare and other sectors may offer future opportunities if their relative strength improves. However, Thursday’s Healthcare decline does not itself confirm an emerging rotation into the sector. Look for sustained outperformance before making significant allocation changes.
6. Maintain disciplined risk management.
The market has recently alternated between gains and declines amid geopolitical uncertainty and volatile commodity prices. Traders should consider position sizing, stop-loss levels appropriate to their strategies, and the risk of sudden reversals. Investors with longer horizons should distinguish short-term volatility from a sustained deterioration in their investment thesis.
7. Outlook for the Next Trading Sessions
Thursday’s session delivered a welcome rebound, with stronger market breadth, gains across all six major banks, and notable advances in selected precious-metals stocks. These developments suggest that buyers returned to the market following Wednesday’s sell-off.
Nevertheless, the TSX has yet to regain its 25-day and 50-day moving averages, and new 52-week lows continue to exceed new highs. The market therefore remains in a period requiring caution rather than an outright bullish conclusion.
The next few sessions will be important in determining whether Thursday’s advance develops into a sustained recovery or proves to be a temporary rebound within a volatile market.
Traders should watch for follow-through buying, improving sector participation, and a continued decline in new 52-week lows. Investors should remain attentive to longer-term technical support, corporate fundamentals, and geopolitical developments that could influence oil prices and overall market sentiment.
Bottom line: Thursday’s rebound improved the immediate market picture, but the recovery still needs confirmation. A sustained improvement in market breadth, technical momentum, and sector participation would provide a stronger basis for a more constructive outlook on the TSX.
.
The US Markets
Thursday’s U.S. Market Indexes
Broad Market Gains, but Technology Weakness and AI Financing Concerns Persist
All four major U.S. stock market indexes advanced on Thursday, although the gains varied considerably across the indexes. The Dow Jones Industrial Average led the major indexes in point gains, while the Russell 2000 posted the strongest percentage advance. Technology-heavy indexes continued to lag, reflecting ongoing concerns about technology stocks, artificial intelligence (AI) investment, and the financing required to support the industry’s rapid expansion.
The Dow Jones Industrial Average rallied 556.21 points, or 1.08%, to close at 52,177.69. The S&P 500 gained 25.12 points, or 0.33%, to finish at 7,744.06. The Nasdaq Composite advanced 20.16 points, or 0.08%, to close at 26,713.03. Meanwhile, the Russell 2000 jumped 37.74 points, or 1.38%, to finish at 2,767.27.

Despite Thursday’s gains, the market outlook remains uneven. Technology stocks, particularly semiconductor companies and firms involved in AI infrastructure, continue to face selling pressure. Investors are increasingly scrutinizing the sustainability of AI-related spending, expected returns on investment, and the financing requirements of companies expanding their AI capabilities. These concerns are contributing to volatility and weighing on technology-heavy indexes.
The Nasdaq Composite remains particularly vulnerable. Although the index advanced on Thursday, its modest 0.08% gain suggests that buying interest remains limited relative to the advances recorded by the Dow and Russell 2000. The Nasdaq has also experienced a difficult stretch over the past six sessions, reflecting persistent uncertainty surrounding the technology sector.
The S&P 500 faces similar risks because of its substantial exposure to large-cap technology companies. Continued weakness in semiconductor stocks and other AI-related companies could put additional pressure on the broader index, even when other sectors perform well. Nevertheless, the S&P 500 remains in a stronger technical position than the Nasdaq based on its relationship with its longer-term moving averages.
Technical Outlook
From a technical perspective, the major indexes are showing mixed signals:
- Nasdaq Composite: The index is clearly below its 25-day moving average and slightly below its 50-day moving average, although it remains comfortably above its 200-day moving average. This configuration points to deteriorating short-term momentum while the longer-term trend remains comparatively resilient.
- S&P 500: The index remains below its 25-day moving average but above both its 50-day and 200-day moving averages. This suggests that near-term momentum has weakened, although the intermediate- and longer-term technical picture remains relatively constructive. Further technology-sector selling could nevertheless increase downside pressure.
- Dow Jones Industrial Average: Despite Thursday’s strong advance, the index remains below its 50-day moving average while trading slightly above its 25-day moving average and comfortably above its 200-day moving average. Its technical position is mixed, with the longer-term trend still positive but the intermediate-term picture remaining under pressure.
- Russell 2000: The index posted the strongest percentage gain of the four major indexes on Thursday. However, according to the supplied technical assessment, it remains below its 25-day, 50-day, and 200-day moving averages. If these readings are confirmed, the index’s technical position remains the weakest of the group despite Thursday’s rebound.
Key Takeaways for Traders and Investors
1. Technology remains a key risk to the broader market. Continued weakness in semiconductor stocks and AI infrastructure companies could weigh on the Nasdaq and limit the S&P 500’s upside potential.
2. Thursday’s gains do not yet establish a broad market recovery. The Dow and Russell 2000 posted stronger percentage advances, while the Nasdaq barely moved higher. This divergence suggests that market leadership remains uneven.
3. Watch the moving averages for confirmation. The Nasdaq’s position below its 25-day and 50-day moving averages warrants caution. The S&P 500’s ability to remain above its 50-day moving average is an important technical consideration, while the Russell 2000’s position below all three averages calls for particular scrutiny.
4. Monitor AI-related spending and financing concerns. Developments affecting AI investment, capital expenditure, financing costs, and expected profitability may continue to influence technology stocks and overall market sentiment.
5. Maintain disciplined risk management. With the major indexes displaying mixed technical signals, traders should avoid assuming that a single positive session signals a sustained advance. Confirmation from subsequent sessions, improving breadth, and stronger price action across sectors would provide a more convincing bullish signal.
Market outlook: Thursday’s session provided some relief for U.S. equities, but technology-sector weakness and uncertainty surrounding AI investment continue to create risks. The next several sessions will be important in determining whether the broader market can build on the rebound or whether renewed selling pressure will push the major indexes lower. Traders and investors should remain selective and monitor both technical levels and developments in the technology sector.
Thursday’s U.S. Market Statistics
Market Breadth Rebounds Sharply, but Underlying Market Internals Remain Weak
Thursday’s trading session delivered a significant improvement in U.S. market breadth on both the New York Stock Exchange (NYSE) and Nasdaq. Advancing stocks substantially outnumbered declining stocks on both exchanges, while the number of new 52-week lows fell sharply from Wednesday’s elevated levels. Trading volume also increased, indicating substantial market participation during the rebound.
Although these developments are encouraging, the number of new 52-week lows continued to exceed the number of new highs on both exchanges. This suggests that the underlying market remains vulnerable despite Thursday’s broad-based improvement. Traders and investors should therefore distinguish between a positive trading session and evidence of a sustained market recovery.
1. New York Stock Exchange (NYSE)
Market Breadth: Strongly Positive
The NYSE recorded a substantial improvement in market breadth on Thursday. Advancing issues significantly outnumbered declining issues, indicating broad participation in the session’s gains.
- Advancing issues: 3,422
- Declining issues: 1,291
- Unchanged issues: 446
- Advancer-to-decliner ratio: 2.65:1
- New 52-week highs: 128
- New 52-week lows: 304
- Total trading volume: Approximately 6.18 billion shares
The advancer-to-decliner ratio of 2.65:1 means that approximately 2.65 stocks advanced for every stock that declined. This is a strong daily breadth reading and represents a significant improvement from the previous session’s bearish conditions.
New 52-Week Highs and Lows: Significant Improvement
The NYSE recorded 128 new 52-week highs and 304 new 52-week lows, compared with 97 new highs and 547 new lows on Wednesday.
This represents an approximately 32% increase in new highs and a 44% decrease in new lows compared with the previous session.
The ratio of new highs to new lows improved from 97:547, or approximately 0.18, on Wednesday to 128:304, or approximately 0.42, on Thursday. In simpler terms, Thursday produced approximately 42 new highs for every 100 new lows, compared with approximately 18 new highs for every 100 new lows on Wednesday.
This is a substantial improvement in the exchange’s internal indicators. Nevertheless, new 52-week lows still outnumbered new highs by more than two to one, indicating that the underlying market condition remains weak.
The previous session’s ratio of approximately 9 new highs for every 50 new lows highlighted the severity of Wednesday’s deterioration. Thursday’s improvement is welcome, but further progress is necessary before market internals can be considered healthy.
Trading Volume
NYSE trading volume reached approximately 6.18 billion shares, compared with approximately 6.10 billion shares on Wednesday.
Based on these figures, volume increased by approximately 1.3%, rather than 22.3%.
The modest increase in volume, combined with the strong advance-decline ratio and sharp reduction in new lows, provides additional context for Thursday’s rebound. However, volume alone cannot establish whether the recovery will continue. Price action, sector participation, and subsequent market breadth readings should also be monitored.
NYSE Assessment
The NYSE’s market internals received a substantial boost on Thursday. The improvement in advancing issues, new highs, and new lows suggests that selling pressure eased considerably.
However, the continued excess of new lows over new highs remains a warning sign. The key question is whether similar positive sessions will occur frequently enough in the coming days to produce a sustained improvement in market internals.
2. Nasdaq Market Statistics
Market Breadth: Broad-Based Improvement
Nasdaq also recorded positive market breadth on Thursday, with advancing stocks substantially outnumbering declining stocks.
- Advancing issues: 3,326
- Declining issues: 1,626
- Unchanged issues: 368
- Advancer-to-decliner ratio: 2.04:1
- New 52-week highs: 76
- New 52-week lows: 534
- Total trading volume: Approximately 11.19 billion shares
The advancer-to-decliner ratio of 2.04:1 indicates that approximately two stocks advanced for every stock that declined. This represents a positive daily breadth reading and suggests that Thursday’s gains extended beyond a small group of Nasdaq-listed companies.
Nevertheless, the exchange’s longer-term internal indicators remain significantly weakened.
New 52-Week Highs and Lows: Better, but Still Concerning
Nasdaq recorded 76 new 52-week highs and 534 new 52-week lows on Thursday, compared with 49 new highs and 699 new lows on Wednesday.
The number of new highs increased by approximately 55%, while new lows decreased by approximately 24%.
The ratio of new highs to new lows improved from 49:699, or approximately 0.07, on Wednesday to 76:534, or approximately 0.14, on Thursday.
Expressed another way, Nasdaq recorded approximately 14 new 52-week highs for every 100 new 52-week lows, compared with approximately seven new highs for every 100 new lows in the previous session.
This doubling of the ratio represents a meaningful improvement. However, the absolute figures remain concerning: 534 Nasdaq stocks established new 52-week lows, compared with only 76 reaching new highs.
Nasdaq’s internal indicators have been under pressure in recent weeks, with new lows frequently exceeding new highs by a substantial margin. Thursday’s improvement is encouraging, but the market needs continued reductions in new lows and a sustained increase in new highs before a more constructive assessment is warranted.
Trading Volume: Strong Participation
Nasdaq trading volume reached approximately 11.19 billion shares, compared with approximately 9.07 billion shares on Wednesday.
Based on these figures, trading volume increased by approximately 23.4%.
The combination of positive market breadth and significantly higher trading volume is encouraging. When an index advances alongside increasing volume, it can indicate stronger market participation and more substantial buying interest.
However, higher volume does not automatically confirm a sustainable recovery. The interpretation also depends on the quality of the price advance, the distribution of gains across stocks, and whether subsequent sessions sustain the improvement.
The Nasdaq’s continued weakness in new 52-week highs relative to new lows remains an important cautionary signal, particularly given the pressure on technology, semiconductor, and AI-related stocks discussed in the U.S. market index report.
Nasdaq Assessment
Nasdaq’s daily market breadth and trading volume improved considerably on Thursday. The advance-decline ratio was positive, volume increased by approximately 23.4%, and the new-high-to-new-low ratio doubled from approximately 0.07 to 0.14.
These developments suggest that buying interest strengthened during the session. Nevertheless, the large number of new 52-week lows indicates that underlying weakness remains widespread.
Traders should watch whether Thursday’s improvement continues over the next several sessions. A sustained decline in new lows, accompanied by stronger participation in new highs, would provide more convincing evidence that Nasdaq’s market internals are recovering.
3. Key Takeaways for Traders and Investors
1. Market breadth improved substantially on both exchanges.
The NYSE recorded an advancer-to-decliner ratio of 2.65:1, while Nasdaq posted a ratio of 2.04:1. These readings indicate broad participation in Thursday’s advance and represent a welcome reversal from Wednesday’s weakness.
2. New 52-week lows remain the principal warning signal.
Despite the sharp reduction in new lows, both exchanges recorded substantially more new lows than new highs. This indicates that the improvement in daily breadth has not yet translated into healthy underlying market conditions.
3. Nasdaq’s higher volume is encouraging, but confirmation is needed.
Nasdaq volume increased by approximately 23.4% alongside positive market breadth. This combination can support the case for stronger buying interest, but traders should look for follow-through gains and improving market internals before drawing firm conclusions.
4. Monitor the high-to-low ratio over the coming sessions.
The ratios improved from approximately 0.18 to 0.42 on the NYSE and from 0.07 to 0.14 on Nasdaq. Continued improvement would be encouraging. A reversal toward rising new lows would suggest that market weakness remains unresolved.
5. Exercise caution amid geopolitical and economic uncertainty.
Geopolitical tensions, changes in global economic conditions, interest-rate expectations, and uncertainty surrounding technology and AI investments can all influence market direction. Sudden changes in sentiment can produce sharp reversals, even after apparently strong sessions.
6. Use disciplined risk management.
Traders should assess position sizes, liquidity, entry points, and predefined exit levels in light of prevailing volatility. Investors should distinguish between short-term trading opportunities and evidence of a sustained improvement in market conditions. Avoid assuming that one positive session has eliminated the risks revealed by weakened market internals.
4. Outlook for the Next Trading Sessions
Thursday’s session provided a meaningful improvement in U.S. market breadth. Both exchanges recorded more advancing than declining stocks, new 52-week lows decreased sharply, and Nasdaq experienced a substantial increase in trading volume.
However, the underlying picture remains mixed. New 52-week lows continued to exceed new highs by a wide margin on both exchanges, suggesting that the market has more work to do before its internal indicators can be considered healthy.
The next several sessions will be important. Traders and investors should monitor whether advancing issues continue to outnumber declining issues, whether new 52-week lows decline further, and whether new highs begin to expand more consistently.
Bottom line: Thursday’s rebound delivered a strong boost to daily market breadth and improved the new-high-to-new-low ratios on both the NYSE and Nasdaq. Nevertheless, market internals remain weak, and continued confirmation is needed. Until the improvement becomes more persistent, traders and investors should remain selective, exercise caution, and be prepared to adjust their positions if market conditions deteriorate again.
.
Thursday’s U.S. Stock Market Wrap-Up Report
Broad Market Rebound Amid Inflation Concerns and Rotation Away from AI-Related Stocks
1. Market Overview: Stocks Advance Despite Inflation Concerns
U.S. equities advanced broadly on Thursday, supported by gains across most major sectors, even as an unexpectedly strong Producer Price Index (PPI) reading raised fresh concerns about inflation.
The Dow Jones Industrial Average rallied 556.21 points, or 1.08%, to close at 52,177.69. The S&P 500 gained 25.12 points, or 0.33%, finishing at 7,744.06. The Nasdaq Composite advanced just 20.16 points, or 0.08%, to close at 26,713.03, while the Russell 2000 jumped 37.74 points, or 1.38%, to finish at 2,767.27.
The divergence among the indexes was notable. The Dow and Russell 2000 posted stronger percentage gains, while the technology-heavy Nasdaq barely advanced. This suggests that Thursday’s buying interest extended beyond large-cap technology stocks, although the gains were not evenly distributed across the market.
Market breadth improved considerably. On the New York Stock Exchange (NYSE), advancing issues outnumbered declining issues by 2.65 to 1. Nasdaq also recorded positive breadth, with approximately two advancing stocks for every declining stock.
However, the market’s underlying internals remain weakened. New 52-week lows continued to exceed new highs on both exchanges, despite a substantial reduction in new lows from Wednesday’s levels. The improvement is encouraging, but further confirmation is needed before concluding that the market has established a sustainable recovery.
2. Inflation Takes Centre Stage
The Producer Price Index was a major focus for investors on Thursday. According to the figures supplied, producer prices rose 1.3% in the latest month, compared with 0.5% in August. The increase was more than double the 0.6% gain expected in a Bloomberg survey and represented the strongest monthly advance since March 2022.
On an annual basis, producer prices increased 6.3%, exceeding the 5.4% consensus estimate. The previous month’s annual increase was also revised upward, from 5.4% to 5.6%.
The stronger-than-expected figures raised concerns about persistent inflationary pressures and the potential implications for Federal Reserve policy. Higher producer prices can eventually feed into consumer prices when businesses pass increased costs on to customers, although the extent and timing of that transmission vary.
For stock traders and investors, the key issue is whether inflation remains sufficiently persistent to constrain monetary easing or keep borrowing costs elevated. Higher interest rates can put pressure on equity valuations, particularly for growth-oriented companies whose expected earnings lie further in the future.
Nevertheless, Thursday’s market performance demonstrated that stronger-than-expected inflation data do not necessarily translate into immediate equity-market losses. Investors were also responding to sector-specific developments, changes in bond yields, and opportunities outside the technology sector.
Data note: The PPI figures and reporting period above are retained from the supplied draft and should be verified against the original Bureau of Labor Statistics release before publication.
3. Sector Performance: Healthcare and Financials Lead
Seven of the ten major U.S. market sectors advanced on Thursday, indicating a relatively broad-based recovery.
Healthcare led the gainers, rising 1.94%. Financials advanced 2.28%, while Basic Materials gained 1.61% and Consumer Discretionary rose 1.25%.
Technology edged down 0.09%, Utilities declined 0.39%, and Energy was the weakest sector, falling 1.33%.
The divergence between Healthcare and Technology is particularly noteworthy. Healthcare’s strong advance, alongside continued weakness in selected technology stocks, is consistent with the possibility of investors diversifying away from crowded AI-related trades. However, one session of relative performance is not sufficient to confirm a sustained rotation of capital.
Financials also performed well, potentially benefiting from renewed investor interest outside the technology sector. Energy lagged as oil prices declined, weighing on shares of several oil-related companies.
Meanwhile, gold futures rose 1.5% to $4,167.60, and silver futures gained 2.2% to $57.11, according to the supplied figures. Strength in precious metals contrasted with weakness in Energy and suggests that commodity-related investments were not moving uniformly.
For traders, the key consideration is to identify which sectors are demonstrating sustained relative strength rather than assuming that all stocks within a sector will move in the same direction.
4. Treasury Yields and the Interest-Rate Outlook
The U.S. Treasury market also attracted attention following the latest inflation data.
According to the figures in the supplied draft, Treasury yields declined across several maturities:
- 2-year Treasury yield: Fell 4.7 basis points to 4.76%.
- 10-year Treasury yield: Declined 10.1 basis points to 5.09%.
- 30-year Treasury yield: Dropped 9.4 basis points to 5.43%.
The decline in yields was notable given the stronger-than-expected PPI reading. Bond yields reflect more than current inflation alone; they can also respond to changes in growth expectations, positioning, demand for government debt, and expectations for future monetary policy.
For equity investors, lower Treasury yields can provide some relief by reducing the discount rate applied to future corporate earnings. However, the significance of that relief depends on why yields are falling and whether the move persists.
Technology and other growth-oriented stocks are particularly sensitive to changes in interest-rate expectations, while financial stocks can respond differently depending on the shape of the yield curve, lending conditions, and credit quality.
Traders should therefore monitor Treasury yields alongside equity prices rather than interpreting either market in isolation.
Verification note: The reported yields are retained as supplied, but the closing levels and daily changes should be checked against a reliable Treasury-market data source before publication.
5. Technology Stocks Remain Under Pressure
Technology continued to be a source of weakness, particularly among semiconductor companies and businesses supplying infrastructure for artificial intelligence.
Taiwan Semiconductor Manufacturing Company (TSMC) fell 1.8%, despite reporting strong third-quarter earnings. The muted market reaction suggests that positive corporate results alone may not be enough to restore investor confidence in the AI trade.
Investors are increasingly scrutinizing the scale of AI-related capital expenditure, the financing required to support infrastructure expansion, and the eventual returns that companies can generate from these investments. These questions are contributing to volatility across semiconductor stocks, data-centre infrastructure providers, and enterprise hardware manufacturers.
Apple Inc. (AAPL) declined 0.3% to close at $341.27, with approximately 39 million shares traded, according to the supplied figures. Apple’s market capitalization reportedly surpassed $5 trillion on Wednesday, with investors responding favourably to its comparatively restrained AI spending relative to some peers.
Enterprise server and hardware manufacturers Hewlett Packard Enterprise (HPE) and Dell Technologies (DELL) also continued to weaken following the previous session’s sell-off.
The contrast between Apple and companies more directly exposed to AI infrastructure spending highlights an important distinction within technology: investors are not necessarily abandoning the entire sector, but may be differentiating more sharply between business models, capital requirements, valuations, and prospective returns.
For traders, this environment favours careful stock selection and close monitoring of price action, trading volume, and earnings expectations. Strong results should not automatically be treated as a bullish signal if the market has already priced in exceptional growth.
6. Sector Rotation: Where Could Investment Capital Go?
The possibility of rotation away from technology remains an important theme for the market.
Healthcare and Financials were among Thursday’s stronger sectors, while selected software stocks advanced despite weakness in semiconductor and enterprise hardware shares. Energy and other sectors may also attract interest as investors reassess their exposure to technology and AI-related investments.
However, sector rotation should be treated as a developing hypothesis rather than a confirmed market trend. Establishing that capital is moving from one sector to another requires evidence of sustained relative performance, trading activity, and broader investor participation over multiple sessions.
Software stocks show relative strength
Several software companies delivered strong gains on Thursday:
- Oracle Corporation (ORCL): Advanced 4.28%.
- Atlassian Corporation (TEAM): Gained 6.1%.
- Salesforce (CRM): Rose 4.5%.
- Workday (WDAY): Advanced 4.2%.
These gains contrast with the weakness in selected semiconductor and hardware stocks. They suggest that investors may be distinguishing between software businesses and companies more directly exposed to the costs and financing requirements of AI infrastructure.
Nevertheless, software companies are not insulated from AI-related risks. Their future performance will depend on earnings growth, valuations, customer demand, competitive pressures, and their ability to convert AI investment into profitable revenue.
Sectors worth monitoring
Healthcare: Thursday’s leading performance makes Healthcare a sector worth watching for continued relative strength. Traders should look for follow-through gains and improving breadth within the sector.
Financials: The 2.28% advance was one of the strongest sector performances in the session. Sustained strength could make Financials an important alternative to technology-heavy positions, although interest rates and credit conditions remain relevant risks.
Software: Gains in Oracle, Atlassian, Salesforce, and Workday suggest that opportunities may exist within selected areas of technology, even while semiconductor and hardware stocks remain under pressure.
Energy: Although Energy fell 1.33% on Thursday, it remains a sector to monitor for potential opportunities if oil prices stabilize or reverse higher. For now, the sector’s weakness argues against assuming that it is already benefiting from rotation.
The objective for traders and investors should be to identify sectors and stocks demonstrating persistent relative strength, supported by price action and fundamentals, rather than reacting to one-day moves.
7. Market Breadth and Internal Indicators: Improvement, but Not Yet Healthy
Thursday’s market statistics showed a substantial improvement in daily breadth on both the NYSE and Nasdaq.
On the NYSE, 3,422 stocks advanced, compared with 1,291 decliners and 446 unchanged issues. The resulting advance-decline ratio was 2.65:1.
The exchange recorded 128 new 52-week highs and 304 new lows, compared with 97 new highs and 547 new lows on Wednesday. New highs increased by approximately 32%, while new lows declined by approximately 44%.
On Nasdaq, 3,326 stocks advanced, 1,626 declined, and 368 remained unchanged, producing an advance-decline ratio of approximately 2.04:1.
Nasdaq recorded 76 new 52-week highs and 534 new lows, compared with 49 new highs and 699 new lows in the previous session. New highs increased by approximately 55%, while new lows declined by approximately 24%.
These statistics demonstrate that Thursday’s rebound involved broad participation and that the deterioration in new lows eased considerably.
However, new lows continued to exceed new highs on both exchanges. The ratio of new highs to new lows improved to approximately 0.42 on the NYSE and 0.14 on Nasdaq, but neither exchange has yet demonstrated a healthy balance between stocks reaching new highs and those reaching new lows.
Trading volume also increased on Nasdaq, rising approximately 23.4% to 11.19 billion shares. NYSE volume increased approximately 1.3% to 6.18 billion shares, based on the supplied figures.
Market interpretation: Thursday’s positive breadth and reduced number of new lows are constructive developments. However, the persistence of numerous new lows, particularly on Nasdaq, indicates that the recovery remains incomplete. Further improvement across several sessions would provide stronger evidence that market internals are stabilizing.
8. Technical Outlook for the Major Indexes
Despite Thursday’s advances, the technical picture remains mixed.
- Dow Jones Industrial Average: Closed at 52,177.69, up 1.08%. The index remains below its 50-day moving average but slightly above its 25-day moving average and comfortably above its 200-day moving average. Its longer-term trend remains comparatively resilient, although intermediate-term momentum warrants attention.
- S&P 500: Closed at 7,744.06, up 0.33%. The index remains below its 25-day moving average but above its 50-day and 200-day moving averages. Its technical position is relatively stronger than Nasdaq’s, although persistent weakness in large technology stocks could weigh on further gains.
- Nasdaq Composite: Closed at 26,713.03, up just 0.08%. The index remains below its 25-day and slightly below its 50-day moving averages, while staying above its 200-day moving average. The combination indicates short-term weakness despite a still-positive longer-term position.
- Russell 2000: Closed at 2,767.27, up 1.38%. Despite Thursday’s strong percentage gain, the index remains below its 25-day, 50-day, and 200-day moving averages according to the supplied technical assessment. This suggests that the rebound has not yet resolved its broader technical weakness.
The divergence between the indexes reinforces the need for a selective approach. A stronger Dow does not automatically mean that technology-heavy stocks are recovering, and a one-day advance in the Russell 2000 does not by itself reverse a weak technical structure.
9. Key Takeaways for Traders and Investors
1. Thursday’s rebound was broad, but the market remains vulnerable.
Positive advance-decline ratios on both exchanges and a sharp reduction in new 52-week lows are encouraging. However, new lows still substantially outnumber new highs, so further confirmation is needed.
2. Technology remains a key source of market risk.
Weakness in TSMC, HPE, and Dell illustrates the pressure facing selected semiconductor and AI infrastructure companies. Investors should continue to assess the sustainability of AI spending and the returns expected from these investments.
3. Watch for sustained sector rotation.
Healthcare and Financials delivered strong performances, while selected software companies advanced despite broader technology weakness. These areas warrant monitoring, but sustained relative strength is needed before concluding that a durable rotation is underway.
4. Treat inflation and bond yields as interconnected market drivers.
The reported PPI increase raises questions about inflation persistence and monetary policy. At the same time, falling Treasury yields can support equity valuations. Traders should monitor the interaction between economic data, bond yields, and equity-market reactions.
5. Focus on confirmation rather than prediction.
The next several sessions should reveal whether Thursday’s positive breadth develops into a more durable recovery. Improving new-high-to-new-low ratios, stronger sector participation, and follow-through gains would strengthen the bullish case.
6. Maintain disciplined risk management.
With market internals still weakened and technology stocks volatile, traders should consider position sizing, liquidity, and predefined exit levels. Investors should distinguish short-term opportunities from evidence of a sustained improvement in market conditions.
10. Outlook for the Next Trading Sessions
Thursday’s session offered encouraging signs for U.S. equities. The major indexes advanced, seven of ten sectors gained, daily market breadth improved on both exchanges, and Nasdaq trading volume increased significantly.
At the same time, inflation concerns remain relevant, selected technology stocks continue to face selling pressure, and new 52-week lows still exceed new highs on both the NYSE and Nasdaq.
The market may be entering a period in which sector selection and stock-specific performance become increasingly important. Healthcare, Financials, and selected software companies are worth monitoring for sustained relative strength, while semiconductor and AI infrastructure stocks remain vulnerable to further changes in investor expectations.
Bottom line: Thursday’s rebound improved the market’s immediate outlook, but it did not eliminate the underlying risks. Traders and investors should remain selective, monitor market internals and Treasury yields, and look for sustained confirmation before adopting a more aggressive bullish stance.
.
NOTICE TO READERS
The Canadian Vanguard Stock Market is about empowering you to build and manage your wealth by yourself. There is certainly no magic in managing finances or wealth but one needs to know what to do and commit to doing what is needed. When you are ready to start the journey to Take Charge and Put Your Destiny In Your Own Hands, start with reading The Canadian Vanguard every market day. If and when you need more related information or to advertise your business products or services in The Canadian Vanguard, Contact Us
Our readers are strongly advised to conduct their own research into individual stocks before making a purchase decision. In addition, investors are advised that past stock performance is no guarantee of future price appreciation. Any recommendation is not a guarantee of any particular stock’s future prices, and The Canadian Vanguard accepts no responsibility or liability for investors’ or readers’ purchases.
Stocks In The News/ Stocks To Watch and Market Strategy will soon be available only to Paying Subscribers. The dollar sign “$” in the Toronto Market section in the articles only stands for Canadian dollar and in the US market section “$” stands for US dollar.
(c) This article is published by The Canadian Vanguard on October 15, 2026